Author: Matt Bailey

Retention Rate: The Magic New Metric for Measuring Hit Potential in Streaming Data

Today’s Tuesdays With Coleman blog post comes courtesy of Matt Bailey, president of our sister company, Integr8 Research. Integr8 Research is focused solely on new music research, and Matt regularly offers thought leadership to his clients regarding the interpretation of streaming data. In this entry, he explains Retention Rate, a new metric to recognize which songs have staying power.

Within a week of its debut, Spotify users in the U.S. played Taylor Swift’s “Anti-Hero” a record-shattering 31 million times—more streams in one week than any other song at the time.

Naturally, CHR and Hot AC stations also immediately added the highly anticipated song by an iconic core artist.

Surely, with record-breaking streaming figures and substantial airplay, “Anti-Hero” was destined to be the most popular song of 2022, as validated by stations’ callout research, right?

Eh.

__________________________________________________________________________________________________________

In this post…

  • Why record-breaking streaming doesn’t mean big hits for radio
  • Introducing Retention Rate
  • Streaming peaks reflect the artist’s power; Retention Rate reflects the song’s appeal
  • Practical ways to use Retention Rate

___________________________________________________________________________________________________________

 WHY RECORD-BREAKING STREAMING DOESN’T TRANSLATE TO BIG HITS FOR RADIO

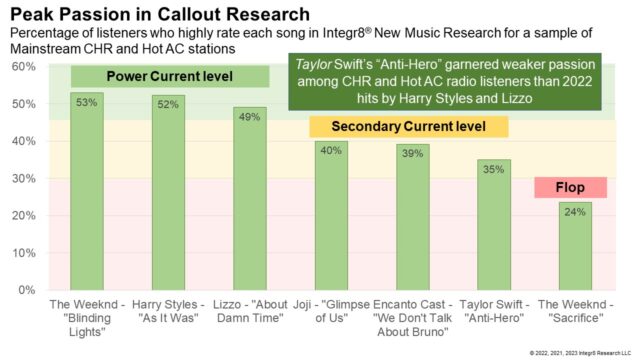
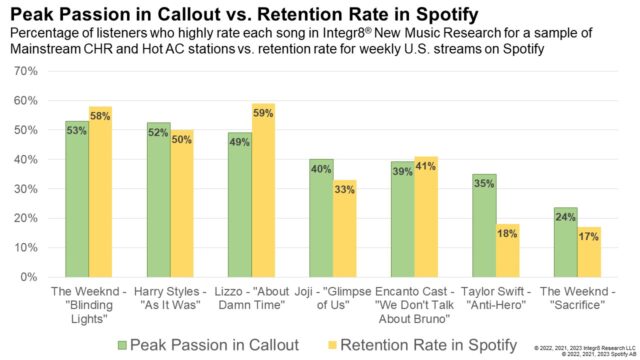
While “Anti-Hero” is hardly a flop, it also hasn’t been the instant home run that “Bad Blood” or “Shake It Off” were. On average, about 35% of CHR and Hot AC listeners said they loved “Anti-Hero” at its peak.

That’s strong enough for a secondary current, but the biggest hits typically see 50% of listeners exhibit strong passion for them using Integr8 New Music Research’s methodology. Harry Styles’ “As It Was” and “About Damn Time” from Lizzo both achieved this metric among our typical clients.

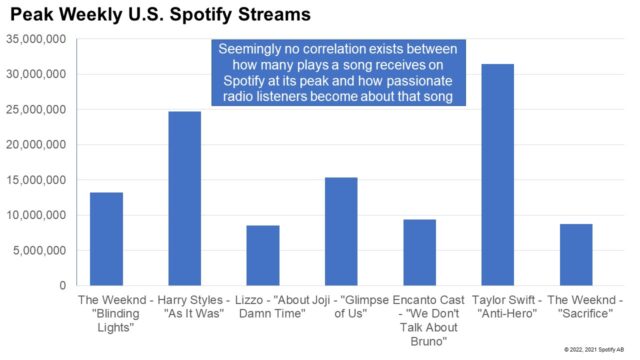
When we examine how these bona fide radio hits performed during their peak week in the U.S. on Spotify, there’s seemingly no correlation at all between streaming plays and passion among radio listeners: “As It Was” had a strong peak week, but Lizzo’s “About Damn Time” maxed out at well under one-third as many streams during its peak week, as did “Anti-Hero.” We will demonstrate this in a bit.

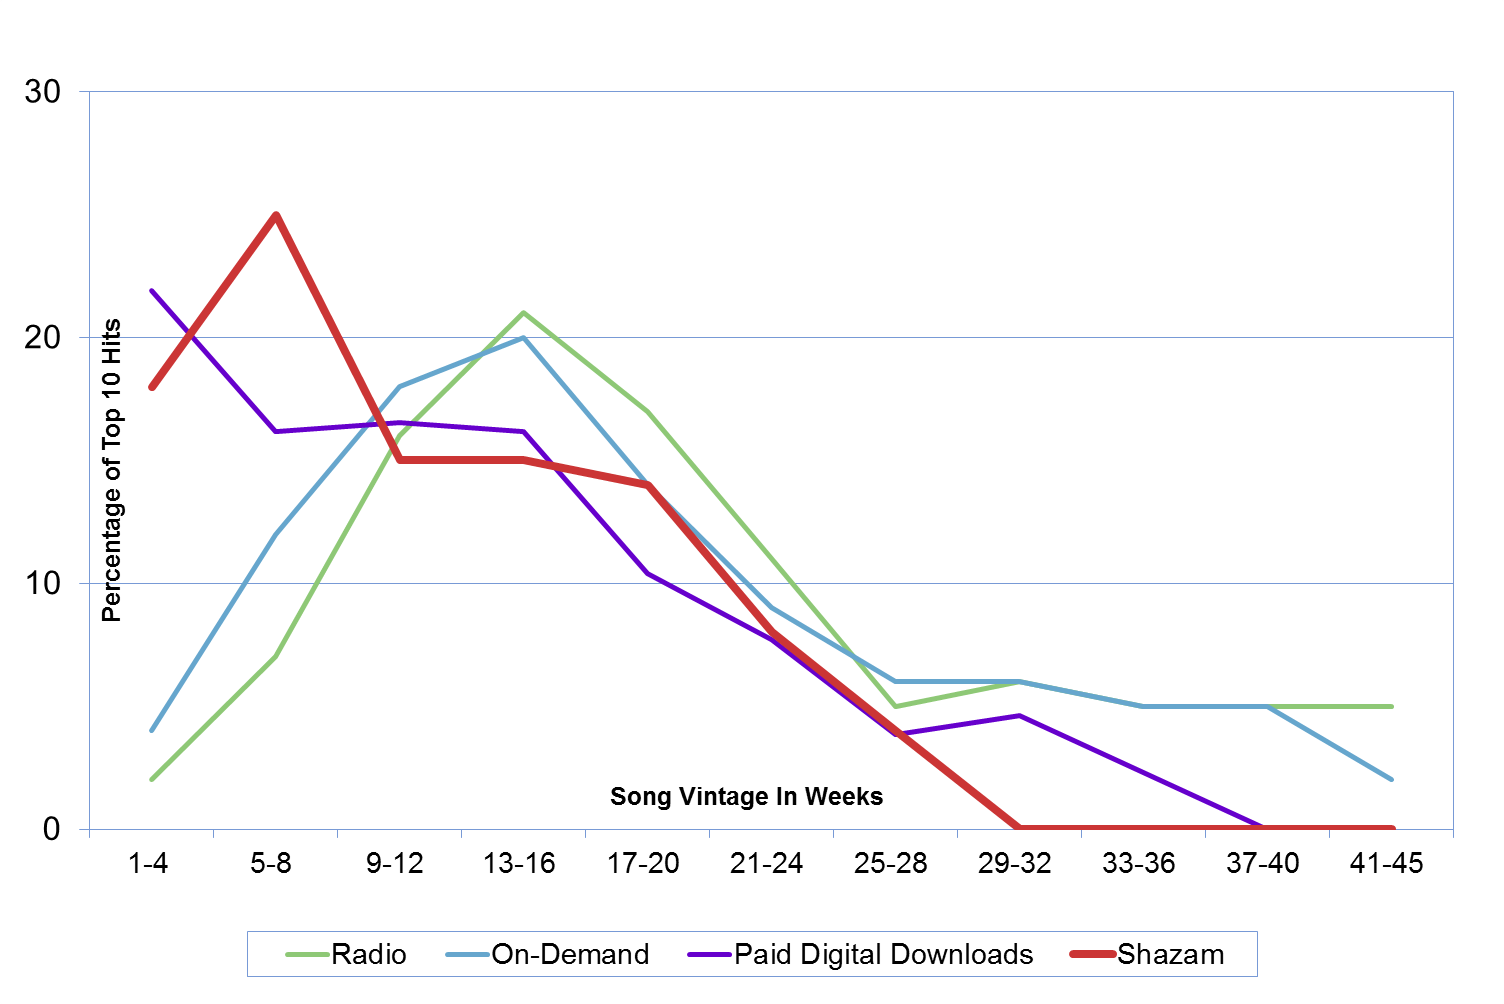
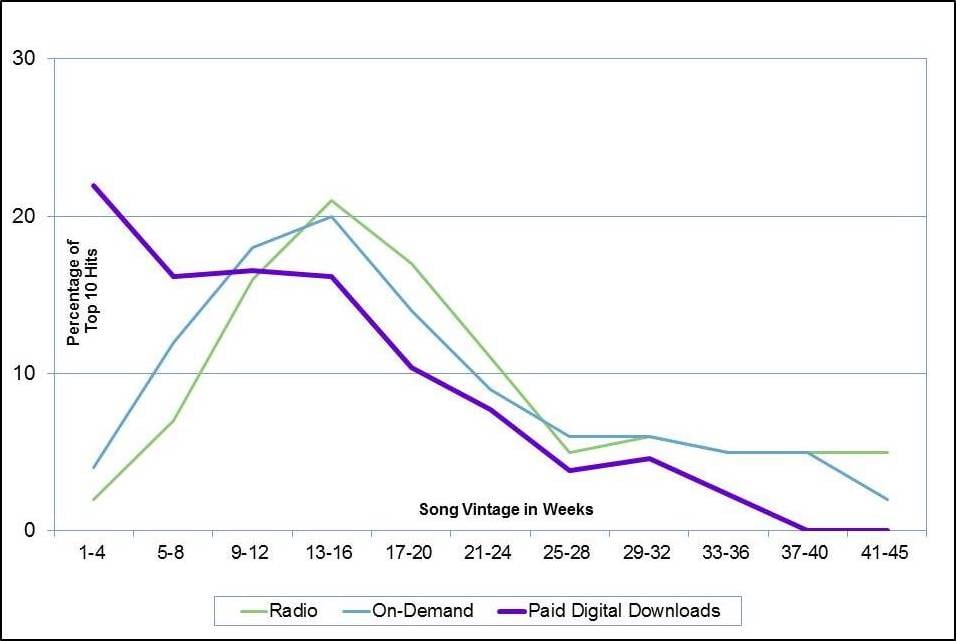
As we’ve noted in several previous posts, streaming data amplifies active fandom, which means a song’s peak week on streaming will often be on or shortly after its debut week. As weeks go by, however, streaming data increasingly reflects the passive fandom of people who discovered the song after its release.

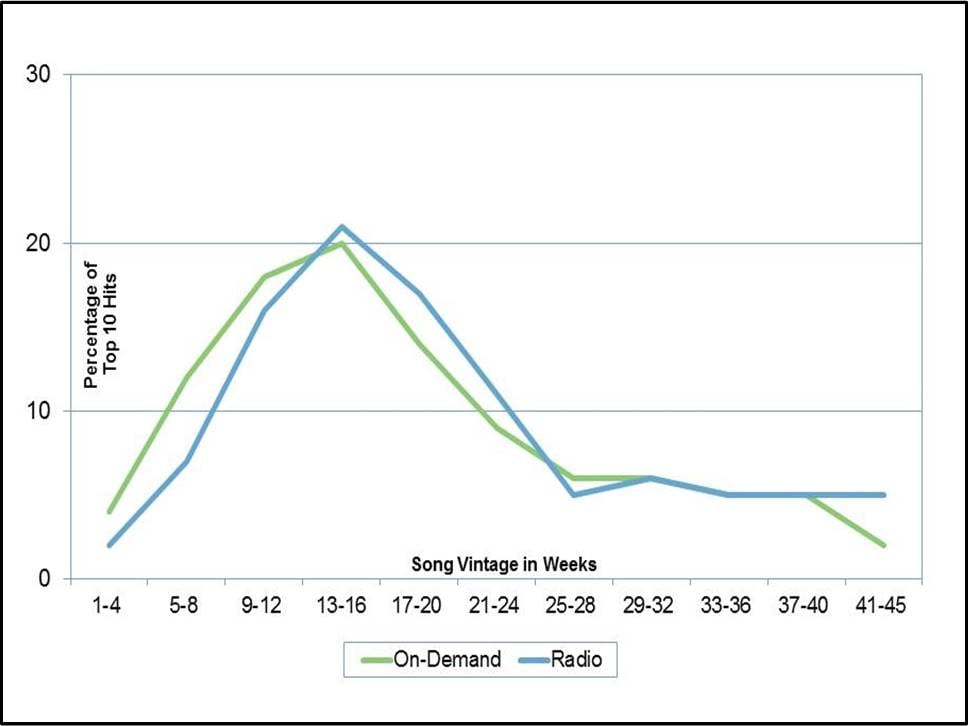
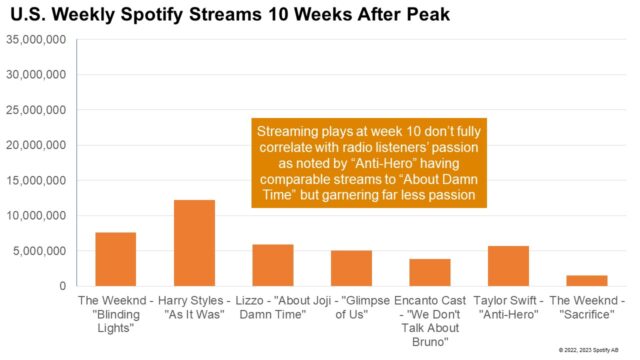
With those behavior patterns in mind, let’s fast-forward to “Anti-Hero’s” 10th week from its peak. (Why 10 weeks? Typical top 10 hits for CHR radio reach their peak passion level among listeners around 10 weeks after debuting.)

Taylor Swift - Anti-Hero

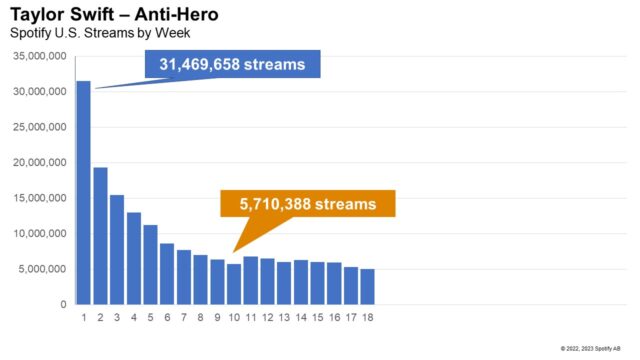
Spotify users in the U.S. played “Anti-Hero” about 5.7 million times ten weeks after its record-breaking debut week. That’s still sufficient to be among Spotify’s Top 10 songs in subsequent weeks. However, that’s less than one-fifth as many plays as its debut.

In contrast, Lizzo’s “About Damn Time” only garnered around 8.5 million streams when it peaked in its fourth week. Fast forward 10 weeks, and Lizzo’s summer anthem was still pulling almost 6 million streams.

Lizzo - About Damn Time

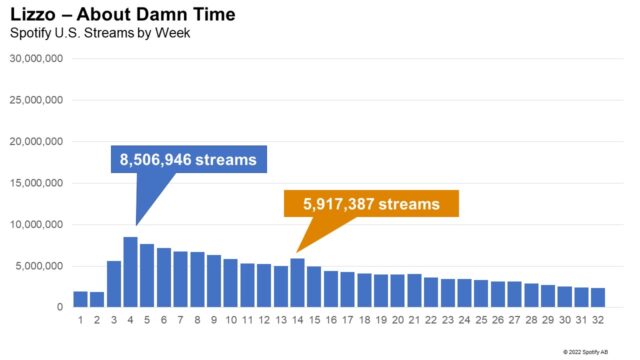
That puts “About Damn Time” on equal footing with “Anti-Hero” in its 10th week after its peak.

However, simply examining how many times people play a song at 10 weeks doesn’t explain why “About Damn Time” was a much bigger radio hit than “Anti-Hero” has been, either. There’s still no clear correlation between streaming plays and callout passion scores.

If you can’t simply examine how a song performs at its peak and you can’t examine how a song performs once the initial interest in the song dies down, is there any streaming metric that does track with listeners’ passion for a song, as measured in your callout research?

Comparing plays for a song’s peak week on Spotify with its play count 10 weeks after its peak reveals a telling story.

INTRODUCING RETENTION RATE

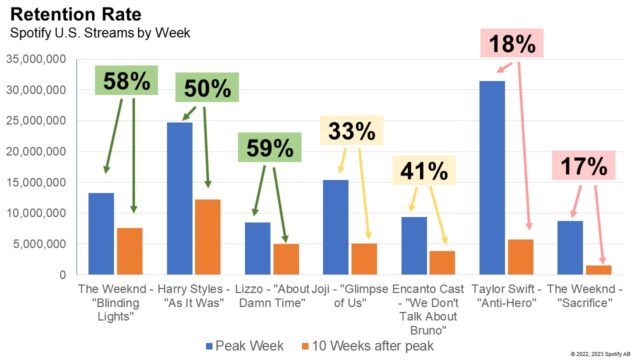
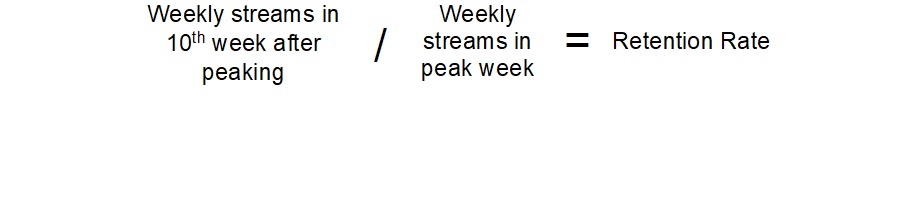
Retention Rate is the ratio of how many times streaming music consumers streamed a song in its 10th week after peaking, compared to how many streamed the song during its peak week.


Comparing the Spotify streaming retention rate for the songs for which we initially examined passion in callout research, we finally begin to see some semblance of a correlating pattern:

Why does Retention Rate make sense?

PEAK STREAMS REFLECT THE POWER OF THE ARTIST’S FAN BASE

A song’s peak streaming week is a measure of how many fans an artist has and how passionate and engaged those fans are. Artists like Harry Styles, Morgan Wallen, Drake, and of course Taylor, have fan bases that run wide and deep. The decision to stream a brand-new song when it drops has everything to do with the artist and nothing to do with the song itself.

In order for a song to continue to garner strong streaming plays, at least one of two things must happen—and generally both:

1) Those diehard artist fans who played the song when it debuted must decide they like it enough to keep playing it week after week.

2) Music fans beyond the artist’s diehard supporters must discover and like the song enough to start streaming it.

For music consumers who like a song but aren’t superfans of the artist, they have to discover the song out in the wild because they’re not explicitly seeking it out: A friend has to tell them to check it out. They have to hear it on a curated streaming playlist. Or perhaps—just maybe—they hear it on the radio.

Usually both #1 and #2 must happen for a song to become a lasting hit.

If an artist’s biggest fans are underwhelmed, it’s unlikely listeners who aren’t even that into the artist will be big fans of the song.

Even for superstar artists like Taylor, there are generally a lot more people who love the song than there are who are hard core fans of the artist. They may “like” the artist, but they’re not buying concert tickets, t-shirts, and fan club memberships.

RETENTION RATE REFLECTS A SONG’S STAYING POWER

Retention rate captures both phenomena. A high Retention Rate means:

  • An artist’s biggest fans like the song enough to keep playing it week after week. A low retention rate means those fans may still love their artist, but found the song itself a letdown.
  • Retention Rate also reflects new people who have discovered a song after it debuted and have gone to Spotify to play it. A low Retention Rate can indicate few people are discovering the song passively.

In short, while a song’s debut streaming plays is a referendum on the size and passion of an artist’s fan base, a song’s ability to remain among the most streamed songs week after week is more predictive of a song’s hit potential.

PRACTICAL WAYS TO USE THE RETENTION RATE CONCEPT

First, forget about using Retention Rate exactly as we have described it here. Nobody has time to track weekly streaming data for dozens of songs week after week in Excel to precisely calculate a 10-week retention rate.

Heck, I don’t have time to do it, but I find it too much fun to resist.

Fortunately, you don’t have to spend hours creating Excel formulas. Here are some easier signs to examine when you’re reviewing streaming data:

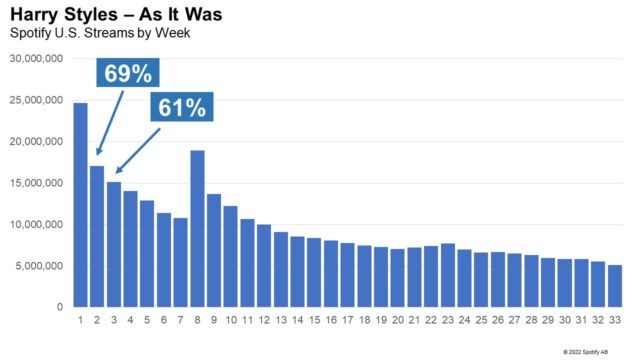
1) How do the song’s streams hold up in the first couple of weeks after debuting?  Harry Styles’ fans in the U.S. played “As It Was” on Spotify over 24 million times the week it debuted. As expected, the song got fewer plays in subsequent weeks—but with 17 million streams in its second week, “As It Was” maintained 69% of its weekly plays in week two. In its fifth week, “As It Was” still garnered 12 million streams a week, holding up over half of its weekly streams at its peak.

Harry Styles - As It Was

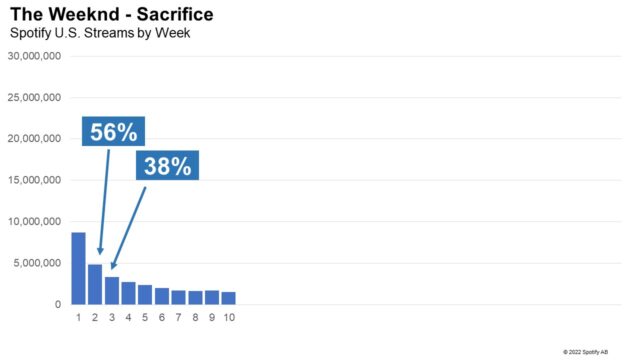
In contrast, The Weeknd’s “Sacrifice” got almost 9 million streams in the week it debuted on Spotify, but users played it less than 5 million times the week after it debuted. Not surprisingly, Integr8 New Music Research clients quickly saw their listeners had little passion for this song.

The Weeknd - Sacrifice

2) Ignore rank in streaming data. “As it Was” and “Anti-Hero” both debuted as the week’s #1 most streamed song on Spotify. However, so did the Weeknd’s “Sacrifice”, even though it got less than one-third as many plays the week it debuted. A big debut by a major artist such as Drake or Taylor Swift will knock hit songs out of streaming charts’ Top 10, even though those songs saw little erosion in actual plays. Bottom line; look at the raw number of times streaming users play a song from week to week, not changes in chart rank.

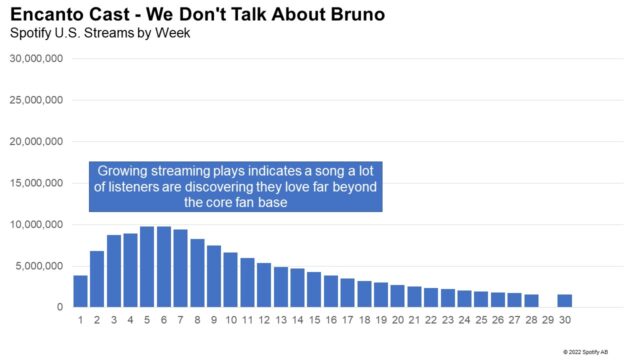
3) Look for songs that are growing week to week. The norm for streaming data is to see big debut weeks. Not all songs work that way. As observed earlier, Lizzo’s “About Damn Time” grew in its first few weeks. As the rare artist whose core fans are older than her casual fans, Lizzo’s “About Damn Time” didn’t see a burst of streaming activity as fans flocked to hear the song right away. Instead, causal fans likely discovered the song on the radio, then went to Spotify to hear it again.

Another example is 2022’s surprise hit “We Don’t Talk About Bruno.” Neither the song nor the movie Encanto were hits when first released in late 2021. But in January 2022, a cold snap and a COVID wave left parents working at home with their kids. Encanto not only came to their rescue to entertain the homebound kids, parents discovered they liked Bruno even after the kids were in bed.

In short, “We Don’t Talk About Bruno” was a song that picked up a much wider fan base than the core Disney fans who played the song when the movie debuted.

Encanto Cast - We Don't Talk About Bruno

Let’s apply these concepts to a song that—as of this writing—is relatively new.

Miley Cyrus - Flowers

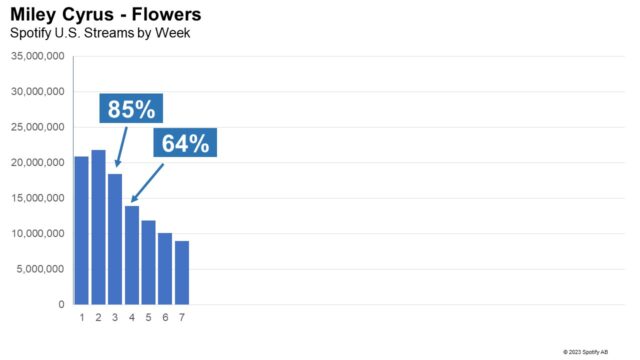
After peaking with almost 22 million streams the week after debuting, Miley Cyrus’ “Flowers” maintained 85% of its weekly plays on Spotify in the U.S. the following week. This pattern suggests—and Integr8 New Music Research clients can confirm—that people are playing “Flowers” because they really like the song, not merely because they’re curious what Miley is up to.

WHAT STREAMING STILL CAN’T TELL YOU

I’ve been urging our clients to use streaming data as one of their new music intelligence tools ever since they were still tracking CD sales. Sadly, many programmers are still hesitant to trust streaming data because its metrics are unfamiliar and confusing. It is my hope that by empowering programmers to understand the story each song’s weekly play counts is telling about each song and its artist, radio programmers can confidently maximize this amazing resource.

However, streaming plays can never tell you everything you need to know about a song to know if your station should play it. It can’t tell you how many listeners know each song, which segment of your audience is most passionate about each song, how many listeners hate a song enough to change stations if you play it, and when listeners are ready for you to move a song to recurrent rotation. For these essential data, high-quality new music research remains the gold standard for selecting songs best aligned with your music strategy.

Want to go deeper? Join Integr8 Research President Matt Bailey for Retention Rate: The Magic New Metric for Measuring Hit Potential in Streaming Data: The Webinar Tuesday, April 19th at 2PM EDT/11 AM PDT.

Registration is now open here.

What You Can and Can’t Learn From Shazam

This is the fifth and final post in a series about how listeners engage with music across traditional and emerging platforms

Shazam, the popular app that tells users the artist and title of just about any song wherever they hear it, is the latest tool raising programmer’s hopes of discovering which new releases will ultimately become big hits.  Shazam’s own CEO claims his service can identify hits months before they become hits anywhere else.

Our analysis of 16 weeks of U.S. Shazam charts reveals that 75% of the Top 10 most Shazamed songs in the U.S. are 16 weeks old or less, with songs most likely to be among the Top 10 songs on Shazam between 5 and 8 weeks.  That’s after song sales peak, but before the 9- to 20-week timeframe when radio exposure and on-demand plays peak.  Thus, while songs do typically peak on Shazam before they peak on radio, the difference is measured in weeks, not months.

shazam blog graph for matt KD

Songs tend to peak on Shazam after sales but before radio exposure and on-demand listening.                                                                                                                                                                                                                                                                     © 2014-2015 Billboard Magazine, Shazam Entertainment Limited


How can you use Shazam to help your station stay on top of new music?  Here are five factors you should consider when examining Shazam for guidance on selecting new music

1) People only Shazam songs when they don’t know them yet.  It would be a mistake to assume your listeners no longer wish to hear a song simply because Shazam users are no longer Shazaming it.  Taylor Swift’s “Shake It Off” remained a Top 10 song on the Billboard Hot 100 chart for 23 weeks.  However, it was no longer among the Top 10 most Shazamed songs after only 7 weeks.  In comparison, Hozier’s “Take Me To Church” was still a top Shazamed song in its 26th week on the charts.  The difference is that Taylor Swift is a much more widely known and recognizable artist than Hozier.  Songs that remain most Shazamed songs are often by artists that are simply not well known and easy to recognize.

2) People only Shazam songs someone else plays for them.  If you want to hear a song on Spotify or YouTube, you have to type in the title or artist to hear it.  If you own the song, you already know the artist and title.  That means people will generally only Shazam songs that someone else plays for them.  That could be while they’re out at a restaurant or a store.  It could be at a nightclub.  It could be a song in a movie, a TV show, or a commercial.  Or, it could very well be on your radio station.

3) People only Shazam songs when they can’t see artist and title information.  If you’re using a radio station’s streaming player or listening via Pandora or Spotify, the artist and title are right there on the app screen, so there’s no reason to Shazam songs you hear on these services.

4) Most of the Top 10 Most Shazamed songs are songs Radio has already started playing.  In a typical week, seven of the Top 10 most Shazamed songs are also already Top 10 hits elsewhere, either on radio, on-demand, or Top 10 on the Billboard Hot 100 chart.  While the songs may not have reached peak radio exposure or on-demand plays at the point they garner the greatest interest from Shazam users, the majority of the most Shazamed songs each week have already began receiving considerable radio exposure.

5) Did Shazam make it a hit… or did your exposure make it a hit?  Imagine you’ve been playing a new song for a few weeks.  You notice more people are Shazaming it, so you increase its spins and tell your personalities to promote it.  Then, your next new music research report reveals the song’s test scores went up.  Did Shazam predict that the song would be a hit or did the greater exposure and promotion you gave the song make it a hit?   While Shazam’s hit-predicting capacity is not yet fully known, radio’s hit-making capacity has been firmly established for many decades.

Bottom Line:  The most impactful use of Shazam is to see which of the new songs you and your competitors have been exposing regularly for a few weeks are sparking the greatest interest of your listeners, typically in a song’s first five to eight weeks. This information—used in concert with other tools and indicators–can help you decide which of the new songs you’re playing deserve the greatest exposure and promotion.  While it can also be helpful at spotting songs that are catching on in clubs or in movies, Shazam is less likely to help you discover new hits out of nowhere than many expect it to do because somebody has to expose a song in order for Shazam users to hear it.

Once a song is an established hit, however, do not assume that listeners no longer want to hear a song simply because they stop Shazaming it:  A key reason listeners stop Shazaming a song is because they have become familiar with it.  That fact that a song remains among the most Shazamed songs for many weeks often speaks more to the unfamiliarity of the artist than the continued appeal of the title.

Finally, as you take advantage of all the amazing new ways to gauge which songs are the biggest hits among music consumers, always keep in mind the unique tastes of your P1 listeners and the expectations they have of your station.   After all, a hit can be a hit because fans buy it; people play it on Spotify, or watch the video on YouTube.  But for radio programmers, the most important factor in determining when a hit is a hit is when your core listeners tell you it’s a hit.

How to Spot a Real Hit from a Viral Video

This is the fourth in a series about how listeners engage with music across traditional and emerging platforms

YouTube has emerged as a key medium for music consumption and discovery, especially among teens and young adults.  Carly Rae Jepsen’s “Call Me Maybe” broke on YouTube.  Psy’s “Gangnam Style” became a cultural touch point on YouTube. Other songs’ videos, such as Baauer’s “Harlem Shake” and Rebecca Black’s “Friday” also racked up record-setting views, but weren’t what we would traditionally consider hit songs.

As part of our ongoing analysis of when is a hit a hit, we examined 26 weeks of Top 10 songs on the Billboard Streaming Songs chart, which includes songs played on both on-demand services (which we examined previously) and semi-interactive internet radio services, but most notably also tracks video views on services including Vevo and YouTube.

First, the same general hit song life cycle that we observed for radio and for on-demand services also holds true for the broader streaming category including YouTube:  Songs are typically growing in their first eight weeks, the majority of the biggest Top 10 songs are between nine and 20 weeks old and songs are typically in decline after 20 weeks.  Secondly, the vast majority of the biggest hits on radio and on-demand are the exact same songs that are the biggest hits when we also include YouTube views.

However, we did uncover a handful of songs that emerge as Top 10 most streamed songs much earlier than songs typically do specifically because of their success on video services such as YouTube.  Does a high volume of YouTube views shortly after a song’s release predict the song will be a hit?

The vast majority of the songs that become overnight YouTube sensations are obviously irrelevant to your radio station:  Weird Al Yankovic’s “Word Crimes” became a most-streamed song overnight, but we know you weren’t expecting it to be a real hit in the long run no matter how many times you saw it on Facebook.  As with most novelties that go viral, it was over after barely a week.  However, many programmers added the Chainsmokers’ “’#SELFIE” when it quickly became a top viewed video, but interest in #SELFIE vanished almost as fast as a selfie on Snapchat.

While “#SELFIE” might be an obvious novelty in hindsight, not all examples of this phenomenon are so obvious.  Nicki Minaj “Anaconda” also topped the Streaming Songs chart early on thanks to its video views.  In fact, it broke the 24-hour streaming record on Vevo with 19.6 million views on day one.  Given the artist, programmers had every reason to believe it could be a big hit.  While it did receive plenty of radio airplay, “Anaconda” didn’t remain a hit for nearly as long as big hits usually do.  Ultimately, the song’s appeal was driven more by the novelty of sampling Sir Mix-a-Lot—coupled with copious footage of Ms. Minaj’s posterior in the video—than by the musical merits of the song itself.

How can you tell the difference between a hit of the year and a viral video of the week?

  • Songs that people mainly watch for the video typically become Top 10 streaming hits in their first four weeks, but tend to disappear almost as quickly as they emerge. Seventy-four percent (74%) of songs that become Top 10 on the Streaming Songs chart within their first four weeks stay Top 10 for less than four weeks
  • Songs that become Top 10 hits beyond YouTube typically take longer than four weeks to establish themselves as Top 10 hits, but are much more likely to remain hits for weeks to come.   Of songs that took more than four weeks to become Top 10 on the Streaming Songs chart, 68% of those songs stay Top 10 songs for four or more weeks

Viral Video blog graph for Matt 2015 02

Songs with videos that catch on quickly usually also vanish quickly (Copyright © 2014 Billboard Magazine)

Iggy Azalea’s “Fancy”, MAGIC!’s “Rude”, Sam Smith’s “Stay With Me”, Nico & Vinz’ “Am I Wrong” and Calvin Harris “Summer” all took at more than four weeks to work their way to become Top 10 most streamed songs.  However, they then stayed in the Top 10 for many more weeks.

Bottom line:  When a song becomes an overnight YouTube sensation, ask yourself:  Is this song popular because it’s a great song in its own right, or are those YouTube views driven by the video and/or by novelty?  In most cases, it will be blatantly obvious.  On that rare occasion when you can’t tell if a new song is the next “Call Me Maybe” or if it is another “#SELFIE,” examine if it’s becoming a YouTube sensation after being out for less than a month.  If it is, odds are the song will vanish almost as quickly as it emerged.

Our final installment in our series will examine Shazam.  Is Shazam the hit-detecting oracle radio programmers have always hoped to discover?

Why Strong Sales Debuts Can Lead To Stiffs

This is the third in a series about how listeners engage with music across traditional and emerging platforms

In our last installment, we demonstrated how music purchasing patterns are fundamentally different from music listening patterns.  Now we look at the importance of a strong sales launch because our analysis reveals that over half of all songs that will ever become Top 10 bestselling digital downloads debut as Top 10 bestsellers in their first week on the charts.

You might assume looking for songs with strong sales debuts will help you pick tomorrow’s big hits.  However, our analysis shows it’s more likely to lead you to stiffs.

We analyzed 26 consecutive weeks of the Billboard® Top 10 Digital Songs chart, which ranks the biggest paid digital download singles in online stores such as iTunes.  We did the same analysis of Billboard’s Top 10 songs for Radio exposure and On-Demand streaming in each of the same 26 weeks that we examined previously.

We found that only one in six songs that debut as Top 10 bestsellers go on to become big hits on radio or on-demand.  What separates the hits from the stiffs?  It turns out that the hits are the ones that not only debut in the Top 10 but stay there for at least five weeks.

matts blog 3

What happens when a song debuts as a Top 10 Digital bestseller?  (© 2014 Billboard Magazine)

As the graph above shows, more than half—56%—of the songs that debut as Top 10 bestsellers in their first week don’t stay there; these are the songs that don’t go on to become big hits in terms of radio airplay or among on-demand streaming listeners.

For example, Ariana Grande & Iggy Azalea’s “Problem”, Ariana Grande & Zedd’s “Break Free” and Maroon 5’s “Maps” were among the 17% of songs that debuted as Top 10 bestsellers and remained Top 10 bestsellers for at least five weeks.  These songs were also among last year’s biggest Top 10 hits on radio and on-demand.

During the same time frame, Ariana Grande & Big Sean’s “Best Mistake”, Shawn Mendes’ “Life of the Party” and four different tracks from pre-teen boy band sensation 5 Seconds of Summer also debuted as Top 10 digital bestsellers, but these songs were among the 56% that were only Top 10 bestsellers in their debut week.  Die-hard fans may have eagerly purchased these artists’ latest releases, but few others wanted to buy or hear them thereafter.

In fact, the biggest hits of 2014, including MAGIC!’s “Rude”, Iggy Azalea’s “Fancy” and John Legend’s “All Of Me,” are notable not because of how strong they debuted, but how well they kept selling week after week.  While most songs are no longer Top 10 bestsellers after 12 weeks, these #1 smashes are among those rare songs that remained Top 10 bestsellers for 17 to 36 weeks.  Undoubtedly, many of the people who bought these songs on iTunes week after week did so because they loved hearing them on your radio station.

Bottom line:  Don’t look at what songs are selling well this week.  Look for songs that keep selling week after week.

Stay tuned for our next installment, which will examine how to spot if today’s YouTube sensation has what it takes to be tomorrow’s big hit.

Why Music Listening Is Different From Music Sales

This is the second in a series about how listeners engage with music across traditional and emerging platforms

Before the advent of callout in the 1970s, radio’s only new music research tool was record sales.  When people stopped buying a record, radio stations stopped playing the record.  In the 1960s, almost every hit you heard on the radio was less than 12 weeks old.

Today, sales data remain a point of insight decades after newer tools for gauging music’s appeal emerged.  Still, clients who rely on our Integr8SM service for insights into their audiences’ responses to new music are often surprised when new songs become top sellers but don’t instantly debut at the top of their new music research that same week.

How do music buying patterns compare with how consumers listen to new music?

To find out, we analyzed 26 consecutive weeks of the Billboard® Top 10 Digital Songs chart, which ranks the biggest paid digital download singles in online stores such as iTunes.  We did the same analysis of Billboard’s Top 10 songs for Radio exposure and On-Demand streaming in each of the same 26 weeks that we compared in our previous post.

The verdict?  Music buying and music listening patterns are fundamentally different. When you understand why they’re different, you’ll also understand how making new music decisions based on sales data can lead your station astray.

Sales vs Radio graph for blog post mb

Digital download sales follow a different pattern than listening behavior (© 2014 Billboard Magazine)

While the majority of songs listeners hear most on the radio and play most on on-demand streaming services (such as Spotify) are between nine and 20 weeks old, the majority of songs listeners buy most are 12 weeks old or less.  That’s the same 12-week pattern that drove airplay in the 1960s when Top 40 radio relied on record sales for many of its airplay decisions.  Unlike radio exposure and on-demand streaming behavior, digital download sales do not build over time.

So, why are buying and listening patterns so different?

Just because people stop buying a song doesn’t mean people stop playing itThink about your own music collection.  You probably own some songs that you forgot about almost as soon as you got them, just as you probably have songs you’ve listened to regularly for years.  When a song’s sales decline, it means fewer new people want to own it.  It doesn’t mean the people who already bought it stopped playing it.

If you exposed new music on your radio station solely based on how well the song was selling, you’d play songs most frequently when hardly anyone in your audience knew the song.  If you were to stop playing a song as soon as its sales dried up, you’d likely be dropping the song at the moment your audience was most interested in hearing it.

This difference was the first lesson radio learned from the advent of callout in the 1970s.

Since the best-selling songs are significantly newer than the biggest songs on the radio and the songs listeners play most on on-demand services, you might assume you could use today’s song sales to predict tomorrow’s hits on your radio station.  In our next installment, we’ll show you why strong debut song sales can lead your station to stiffs—and what to look for in song sales data to avoid those stiffs.

When Is A Hit A Hit?

This is the first in a series about how listeners engage with music across traditional and emerging platforms

For decades, radio has debated the question of how fast stations should move through contemporary music.  When modern music research first emerged in the 1970s, radio stations began holding on to hits longer than they did in the 1960s when they realized listeners still loved and listened to songs weeks after they stopped buying the record.  Ever since, the question comes up every so often whenever changes in music consumption or audience measurement emerge, such as the advent of PPM® or the emergence of streaming media.

Many of North America’s leading contemporary music stations rely on Coleman Insights for our Integr8SM service, which provides these stations with research on how their target audiences respond to new music.  Three questions our Integr8 clients always ask are:

1. How long should I give new songs to catch on with my audience?
2. At what point do new songs reach their peak with typical listeners?
3. At what point should I consider a song no longer a hit, no matter how much listeners still love it?

Does the vintage of the songs radio gives its listeners vary dramatically from the songs music fans play for themselves when they choose to be in control of their own music?

To find out, we analyzed 26 consecutive weeks of Billboard® Top 10 On-Demand Songs (charts that rank the biggest songs of on-demand streaming services such as Spotify) to determine the age of the songs listeners play most when they’re in control of their music.  We then pegged each song’s vintage to when it first entered the Billboard Hot 100, so that we can see when each song first entered the public consciousness, not when the record company released it.   We then did the same analysis of Billboard Top 10 Radio Songs in each of the same 26 weeks.

The results?  The vintage distribution of on-demand’s biggest hits is remarkably similar to the vintage distribution of radio’s biggest hits.  On-demand’s curve leads radio’s curve, but the difference is measured in days, not weeks.

MB blog graph w axis labels
Percentage of Top 10 Hits by Vintage in Weeks (Copyright © 2014 Billboard Magazine)

While there are slight variations between on-demand streaming and broadcast radio exposure, a comparable pattern of song development emerges for both media:

1. Songs are typically growing in their first 8 weeks
2. The majority of the biggest songs are between 9 and 20 weeks old
3. Songs are typically in decline after 20 weeks.

Of course, there are variations in the performance of individual songs.  As a recently circulated graphic published by Spotify’s Director of Economics highlighted, Meghan Trainor’s “All About That Bass” caught on faster on streaming services in the U.S. than it did on radio.  Tove Lo’s “Habits (Stay High)” also broke on Spotify before radio picked it up.  Other songs developed faster on radio than on streaming media, such as Maroon 5’s “Maps.”  Finally, one particular song, Idina Menzel’s “Let It Go”, was huge on streaming but absent from radio, a fact many Frozen-weary parents appreciate.

Beyond these few notable exceptions, we are struck by just how similarly most of the 45 songs we examined developed on radio and on-demand services.  Many of the songs that radio programmers thought would never go away, such as OneRepublic’s “Counting Stars,” Katy Perry’s “Dark Horse” and John Legend’s “All Of Me,” were the very same songs listeners continued to play for weeks on the on-demand platforms long after the typical expiration date.

In upcoming installments, we’ll show why music purchasing habits follow a fundamentally different pattern than music listening behavior, plus we’ll examine how Shazam fits into this picture.

But Our Facebook Fans All Said…

What a local rezoning fight can tell you about the challenges of listening to listeners.  

Recently, I got involved in a hotly-debated rezoning issue in my town.  (The proposal would replace old strip malls with multi-story mixed use development.)   While it was the sudden onslaught of middle age that turned me into a responsible citizen, what fascinated the media researcher in me was where supporters and opponents chose to voice their opinions:  Had you only tracked people who spoke in person at town council meetings, you’d conclude that 90% of residents opposed the rezoning plan.  Had you only read the local newspaper, you’d think 70% of residents were against it.  However, if you tracked the issue on Twitter, you’d conclude almost everyone in town supported the rezoning plan.

For radio, this discrepancy highlights the danger in gauging the opinions of your listeners only in one place.  How many times has a station been trashed on Facebook for changing formats, only to see its ratings improve after the change?   How often do an artist’s rabid fans call and text to request a new song that never catches on in callout?  There have never been more ways to stay in contact with listeners and make your relationship with them a two way connection.  The challenge, however, is making sure you don’t take what you hear only in one place as representative of your entire audience, whether it’s on social media, from request lines or at live remotes.

As for that rezoning issue, in the ratings book of politics, every candidate who campaigned against new development lost hardily in the last election.  With that knowledge of their audience, our town council approved the plan six-to-three.