Good morning from the world’s largest podcasting conference, Podcast Movement in Washington, DC! From the first time I attended this great event in Philadelphia six years ago, I felt an energy that always excites me about returning.
No one should debate podcasting’s strength as an audio medium. Like radio, there is power in the spoken word, in the ability to paint mental pictures and tell stories. It is magically portable. Easy to listen to on the go, whether in the car, while taking a walk, or riding the subway.
If you think about the ways early podcast consumers listened to podcasts, you might visualize this:
Photo credit: Mojahid Mottakin / Shutterstock.com
The Apple Podcast logo was essentially the de facto logo for the medium, a true indication of the power of branding. Apple was the right platform for podcasting because the app was native to Apple devices—no need to go to the App Store and download it.
But consumer habits change.
While iOS is still the leading operating system over Android in the United States, it’s not by a ton (about 60%-40% according to TechRepublic), and globally Android dominates iOS (about 70%-30%).
So, it’s no longer just about the convenience of the native app on your phone. It’s what brands win the mind of the consumer. And it’s important to note some crucial changes that have taken place.
While Apple is a favorite of many creators, a remarkable thing happened to two other platforms on the consumer side.
- Spotify went from 30 million active users in 2013 to 626 million in 2024.
- YouTube went from 532 million active users in 2019 to 868 million in 2023.
Consumers made a behavioral shift to Spotify and YouTube because their brands grew, and they offered content their audiences found appealing. If you’re not putting extra energy into these platforms, you’re not fishing where the fish are.
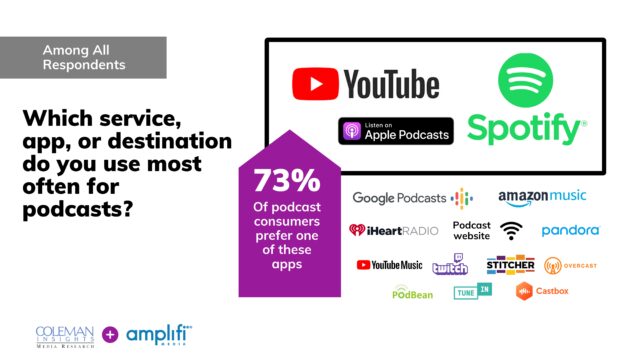
One year ago, I presented the landmark “New Rules of Podcasting on YouTube” study at Podcast Movement in Denver with Steve Goldstein of Amplifi Media. This benchmark research project explored the perceptions and usage of video among American podcast consumers. Here are three key takeaways.
- 73% of podcast consumption is dominated by three platforms…YouTube, Spotify, and Apple.
One of these platforms is all video. One has publicly stated in recent months that it is going all-in on video. On my personal Spotify account, I’m now getting video podcast recommendations on my home page before audio versions.
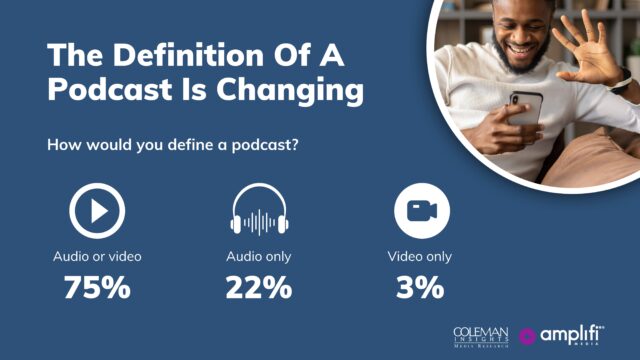
- Consumers don’t see podcasting as an audio-only medium.
We were intentional in our study to not use the word “listen” when referring to a podcast because we felt it was important to understand whether consumers see podcasting as an audio-only medium. They used to, but they don’t anymore.
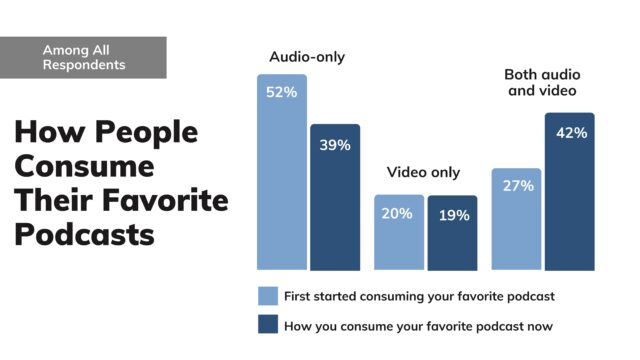
- More podcast consumers now say they consume their favorite podcast via audio and video than just audio.
If a fan of your podcast searches for a video version and it’s not there, do you think YouTube or Spotify’s algorithms will suggest other shows that will take your audience away from yours?
Of course they will.
After I presented this study, many subsequent conversations followed with creators and networks. We acknowledged that there is no “one size fits all” video solution for every podcast. Not every podcast needs to, or even should, offer complete episodes on video. Even if starting with the usage of video as a marketing tool, using trailers and clips, it is a great place to begin the journey.
And yet, there were two words I knew I could count on hearing from all of them.
“Yes, but”.
“Yes, but the views are miniscule relative to the time we spend”.
“Yes, but YouTube’s advertising restrictions are horrible”.
“Yes, but no RSS feed”.
“Yes, but we can’t sell it”.
“Yes, but I don’t have the staff”.
“Yes, but it’s a trend”.
As my therapist might say, your feelings are valid. But they miss the big picture.
Most of the research I conduct for podcasters at Coleman Insights is perceptual research. We may take a deep dive, for example, into the behavior of fans of Kids & Family podcasts or fiction podcasts. Maybe we’re digging into perceptions of sports podcast users.
This type of research is very different than top-line usage analytics, which don’t dig into brand images that influence behavior. Perceptions in podcasting are changing, and that is changing behavior.
In a couple of hours at 10:15 AM EDT, I’ll join a panel for a session called “Stop Leaving Impressions On The Table: Vodcasting Is Podcasting” moderated by Carl Weinstein, COO of Locked On Podcast Network. Locked On features a local podcast for every team in every major sport. Weinstein’s network jumped into vodcasting (video podcasting) years ago, and fully resisted “yes, but”. I asked him a few questions about their experience.
![]()
Q: When did Locked On embrace video? Why was it important for Locked On to embrace it early, when most podcasters are only now considering it as an integral part of their strategy?
A: We began adding the video simulcast of all our podcasts to our entire lineup in 2021. It was less about embracing it early than it was about meeting the audience where they were. The signs were already there in 2021, actually before then, that the audience was already defining a podcast differently than the industry was at that time. To reach the total potential audience, we needed to move towards them and could not expect them to move back towards us. We jumped in with both feet and never looked back.

Locked On Podcast Network Chief Operating Officer Carl Weinstein
Q: How has it performed compared to audio and what are some of the key differences? Why do you think it’s been so successful for you and not as successful for others?
A: Performance has been amazing. I think largely because we tapped into a totally new audience and also because discovery on the primary video platform, YouTube, is so much better than discovery on the traditional audio podcast apps. Hard for me to speak to what others are experiencing, but I think for us, we are tailor-made for the video platforms and experience. Our podcasts are daily, our podcasts are shorter than most others in the market (30 minutes or less), and we cover sports, targeting one of the most passionate, widest-reaching affinity groups in media.
Q: Seems many creators are concerned about tracking and attribution with YouTube. How have you handled that?
A: We have an amazing advertising ops team. We have developed our own systems and processes for tracking and reporting and have worked with our advertising partners to optimize each for their needs. We are also on OTT, both VOD (Video On Demand) and FAST TV (Free Advertising-Supported Streaming Television), so with each platform we must address a unique set of requirements and needs. Not necessarily easy, and certainly time and resource-consuming, but totally doable and worth the effort.