When you see research results, you’re usually not seeing the entire picture. That is, after all, what we at Coleman Insights and other research firms get paid for. The results of a study arrive in mounds of raw data, which get turned into spreadsheets, which we spend countless hours analyzing (and agonizing!) over. We look for insights that tell the story behind the data, turn them into graphs, and share.
Behind those key findings is what sometimes feels like an endless data supply. Even the spreadsheets we dissect don’t show the whole picture, because we can run the numbers in so many ways.
Take our recent State of Video Podcasting study I collaborated on with Steve Goldstein at Amplifi Media. We shared some big headlines, such as:
- The definition of a podcast is now interchangeable, with 85% of podcast consumers defining it as audio or video
- It’s now a hybrid medium, with 77% of podcast consumers moving between audio and video
- YouTube has extended its lead as the #1 podcast platform, with a staggering 70% using the platform for podcasts (Spotify is #2 at 52%)
- Social media has overtaken Friends and Family as the #1 discovery method
- Smart TVs are now the #2 method of consuming podcasts on YouTube
These are some big headlines, for sure. But if video podcasting is part of your world and evolving strategy, it could be interesting to know, for example:
- How the results of our survey differ by platform consumption, so you know which ones to focus on. Sure, YouTube, Spotify, and Apple are the big three, but which ones are most relevant to your target demographic? Or specific category fans that may apply to your strategy?
- Social media is barely #1 for discovery over Friends and Family overall, but it’s not that close among Gen Z. Other social media platforms shift to higher and lower positions for discovery among this age group and a platform in double digits that surprised us. If you target this group, it’s valuable information.
- The results change based on consumption frequency. When we run it among daily podcast consumers, for example, some interesting patterns emerge.
- Some categories are more conducive to video than others. Which ones?
- Did you know Spotify allows comments on its podcasts? We asked about the importance of comments and engagement.
We love to use crosstabs (short for cross-tabulation), which analyze the relationship between two or more variables. In other words, we can show you podcast discovery overall…and by any slice of age group, gender, ethnicity, or geography. Or by which podcast platform they prefer. Or by consumption frequency. Or method (audio, video, or both). Or which categories they love. Or which social media platforms they use.
That’s just one question, and a small example of the cross-tabbing possibilities.
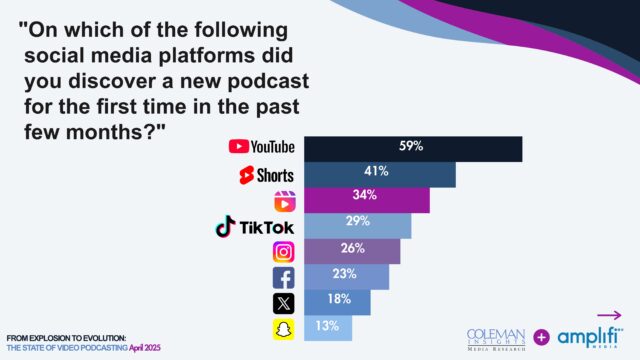
This graph shows podcast discovery by platform overall, but it differs by audience segments.
This data can be customized and sorted to use for your specific strategy. Imagine an agency using the data to help advise clients on their specific needs. A network using it to inform strategy on specific shows based on their respective targeting.
If video podcasting strategy is important, this data is a gold mine. While a custom study for your specific goals is ideal, it may not be feasible. That’s why we’re making it available and affordable, with three levels as low as $3,000 to access the entire study, up to $7,000 for a version customized to your strategy and a presentation to your team by me and Steve.
You can read all about the study, download the summary, and watch our webinar here. If you’re interested in the full data, fill out the contact form on the page or just email me directly at jaynachlis@colemaninsights.com.
As you’re reading this I’ve landed in London, preparing to attend The Podcast Show for the first time. If you’d like to meet in person, please let me know that as well.
Podcasting is alive and well and we’re excited to be part of its evolution.
Cheers!