![]()
Over the last couple of weeks, we’ve shared some interesting findings about the current state of contemporary music. John Boyne compared this year’s study to the movie Groundhog Day, as some of the results appeared frozen in time. Warren Kurtzman discussed how Pop once again overperformed in this year’s version of the Contemporary Music SuperStudy. In this final Tuesdays With Coleman blog installment about Contemporary Music SuperStudy 3 before our deep dive webinar, we’ll focus on how music tastes correlate with how you choose to consume music.
One thing is for certain. There are very clear differences in this data. But first, what’s not different.
No matter how you slice the data, by various demographics, whether you listen daily to AM/FM Radio, podcasts, streaming services, or smart speakers, you are likely to see Pop perform well. Pop is the one mass appeal genre that crosses demographics, genders, ethnic groups, and consumption habits. After that, we see a number of interesting differences.
Country is more prevalent in the best testing songs of women and consumers 35-54. Hip Hop/R&B is more prominent among consumers 12-34 and men.
Country represents 18% of the Top 100 of women, but only 8% among men. 12 to- 34-year-olds have almost no Country (4%) in their Top 100, but Country represents 33% of the Top 100 among 35 to- 54-year-olds. 30% of the Top 100 among men is comprised of Hip Hop/R&B, compared to a solid 23% for women. Consumers 12-34 have 43% Hip Hop/R&B titles in their Top 100, while 35 to- 54-year-olds have only 11% Hip Hop/R&B.
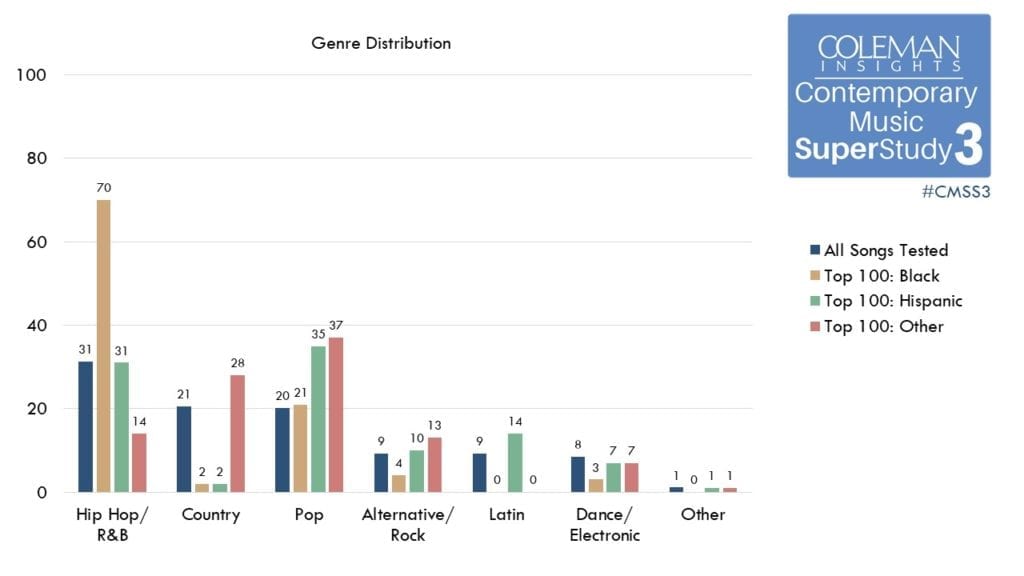
The most popular songs among Black and Hispanic consumers are Hip Hop/R&B, with very little Country. Caucasian/Asian/Other consumers have lots of Country, far less Hip Hop/R&B, and more Alternative/Rock.
Hip Hop/R&B comprises a massive 70% of the Top 100 among Black consumers, while Country represents only 2%. Though Pop is the top genre for Hispanic consumers, Hip Hop/R&B is a strong #2 at 31% and Country also only represents 2% of their Top 100. Country represents the second biggest genre among Caucasian/Asian/Other consumers behind Pop (28% of their Top 100), while Hip Hop/R&B trails well behind at 14%. Alternative/Rock at 13% is most prevalent with this ethnic group.
Country is huge with Rural consumers, but not with Urban or Suburban this year. Hip Hop/R&B goes the other way; big with Urban and Suburban, not with Rural.
Rural consumers have 43% Country in their Top 100. Last year, Country represented 27% of the Top 100 among Suburbanites, but this year it drops to 7%. Urban consumers have even less Country in their Top 100 (5%). Pop is tops with Urban and Suburban consumers, but Hip Hop/R&B is #2 with these groups at 30% each. Rural consumers in contrast have only 15% Hip Hop/R&B titles in their Top 100.
Liberal leaning consumers have a large amount of Hip Hop/R&B but almost no Country in their Top 100. Conservative leaning consumers prefer Country and have only a small number of Hip Hop/R&B titles in their Top 100.
Country music and political orientation appear to go hand in hand.
Daily streaming service listeners are more likely to have Hip Hop/R&B in their Top 100 and less likely to rate Country highly.
Pop represents 40% of the Top 100 of streaming service listeners, followed by Hip Hop/R&B at 29%, and Alternative/Rock at 12%. Country trails with only 9% of the Top 100, tied with Dance/Electronic.
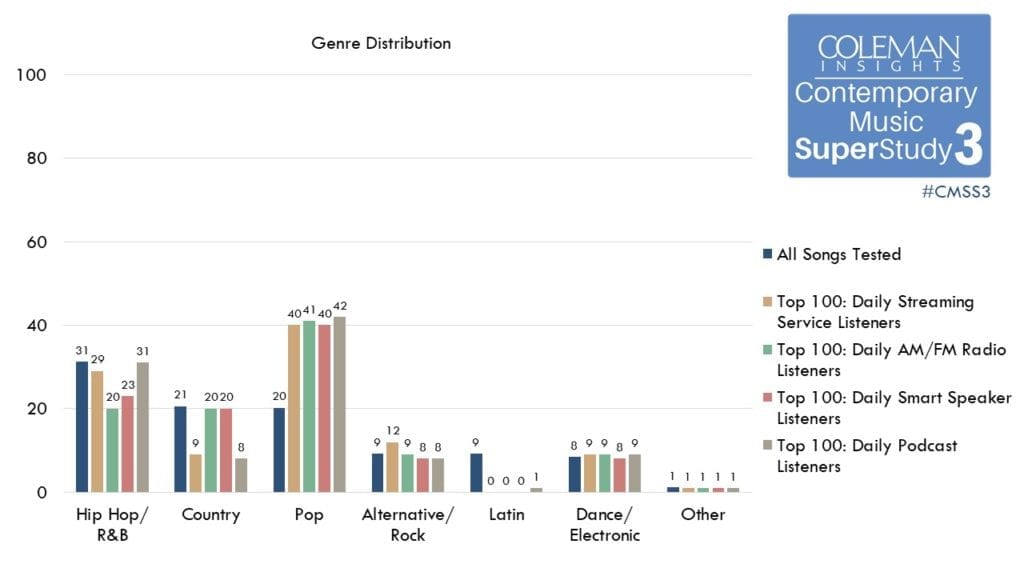
While Pop is king among daily AM/FM Radio listeners, the balance of their Top 100 includes equal amounts of Country and Hip Hop/R&B. FM Radio listeners love Pop the most, at 41% of their Top 100. But for these consumers, Hip Hop/R&B and Country are tied for second place, at 20% each.
The tastes of daily smart speaker listeners are very similar to daily AM/FM Radio listeners.
Interesting correlation that we plan to spend more time studying in the future.
The tastes of daily podcast listeners are very similar to daily streaming service listeners.
Like the previous correlation, likely worthy of greater investigation.
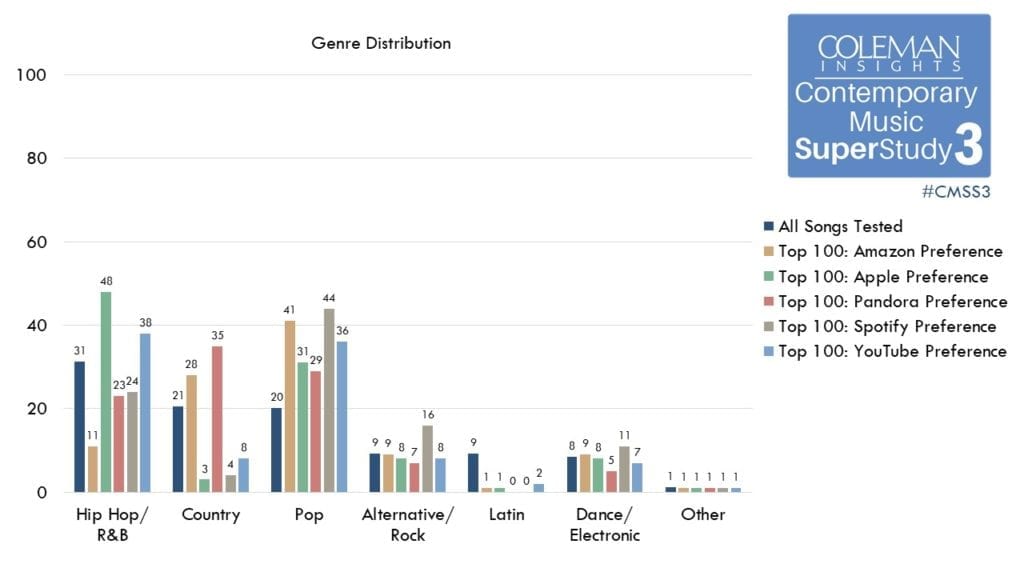
Consumers who prefer Apple Music and YouTube have a large percentage of Hip Hop/R&B in their Top 100, but very little Country.
Apple Music and YouTube partisans are the two consumer segments that have a larger percentage of Hip Hop/R&B than Pop in their Top 100. It is particularly notable that streamers who prefer Apple Music have a Top 100 made up of nearly half (48%) Hip Hop/R&B titles. Country makes up a miniscule portion (3%) of Apple Music listeners’ Top 100, while Country makes up 8% of the Top 100 of streamers who prefer YouTube.
Consumers who prefer Pandora and Amazon Music have a large percentage of Country in their Top 100, but significantly less Hip Hop/R&B.
Pandora is the most pronounced example of Country’s dominance with this platform. At 35% of the Top 100 among streamers who prefer Pandora, Country even exceeds Pop at 29%. While Pop is the dominant genre for streamers who prefer Amazon Music, Country comes in second. Hip Hop/R&B represents only 11% of the Top 100 with Amazon Music listeners.
Consumers who prefer Spotify have lots of Hip Hop/R&B and less Country, but are also more likely to have Alternative/Rock in their Top 100.
Mirroring its large popularity, Pop performs best among Spotify listeners, representing 44% of their Top 100. Hip Hop/R&B is second at 24%. Alternative/Rock is third with Spotify listeners, which is notable because the 16% of Alternative/Rock songs in their Top 100 is quite a bit more than the percentage among other streaming service partisans.
Of course, this doesn’t mean streaming charts will stay within these defined taste parameters. This past week, “Montero (Call Me By Your Name)” by Lil Nas X led the Spotify Top 200 Chart and “Astronaut In The Ocean” by Masked Wolf topped the Pandora Top Spins chart. Having a larger understanding of music tastes within each platform should help you better understand the charts and provide some clarity in navigating the numbers.
Later this spring, active Coleman Insights clients will receive the song-by-song data this spring as part of our Coleman Complete promise.
Up next, we’ll dig deeper into the numbers with the Contemporary Music SuperStudy 3 Deep Dive webinar, Thursday, May 13th at 2PM EDT/11AM PST. Register now.
This is both telling and confirming what many programmers have generally believed, I appreciate the Coleman sharing of information.
What about the 55+ audience? Were they surveyed at all? If so was their interest split between Pop/Rock/R&B-Motown/Country/Lawrence Welk?
Asking for a friend.
We didn’t survey 55+, I’m sorry. This friend of yours, is his name Dwayne?