![]()
Ever thought about how we’re living in the golden age of quite a few things?
Not that long ago, Sam Adams was the best craft beer option if you didn’t want a Budweiser or Miller Lite. Today, breweries dot the landscape with a multitude of options ranging from Lagers to Porters to IPAs.
We’re certainly living in the golden era of content. If you’re like me, you have a “content queue.” I’ve got at least six or seven recommended TV shows on streaming services I want to get to but haven’t had the time. Same for podcasts. There are three or four True Crime podcasts alone I keep meaning to start.
Speaking of podcasting, as I just returned from another content-rich Podcast Movement conference in Dallas, it strikes me that the industry is in the golden age of analytics.
In contrast to the radio industry, which relies almost exclusively on ratings services like Nielsen and Eastlan for its measurement, the podcast industry has so many tools to navigate it can be overwhelming. Generally speaking, it’s a great thing. Podcasters can easily access analytics directly from platforms like YouTube and Apple. Hosting platforms like Blubrry, Libsyn, and Anchor offer at least a baseline of statistics with a subscription that can cost as little as a few bucks a month and more for an additional charge. And in contrast to radio stations that hope and pray that the sample size will be reasonable, and ratings won’t show a strange inexplicable rollercoaster, if the software shows someone has listened to your show, they’ve listened to your show.
Chartable is an example of software that does a great job of taking analytics a step further. Some of these features include providing some demographic information, episodic retention analytics, and via Apple and Spotify integrations, the percentage of each episode that was completed. While all these analytics are extremely valuable and provide an important service to podcasters, they may also provide a bit of false comfort. Meaning, just because so many analytics are available doesn’t mean podcasters are getting all the data they need.
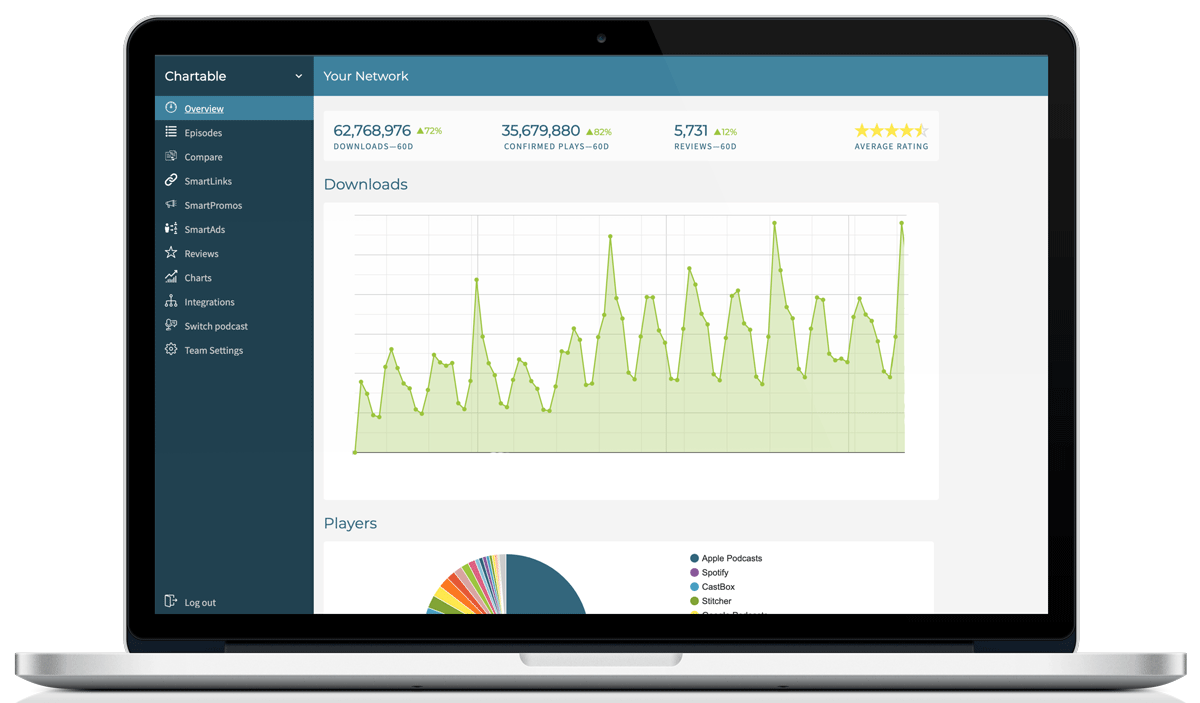
Example of a Chartable dashboard
As the radio industry learned a long time ago, ratings information can only tell you so much. Ratings tell you how people behave. They don’t tell you why they behaved that way. When you rely on ratings information to make programming and content decisions, bad things can happen. If the morning numbers sink three months in a row in radio, does it necessarily mean the show has suddenly declined in popularity or its content decisions suddenly deteriorated?
It does not.
Over years of doing research studies for radio, we’ve seen occasions where ratings declines made all kinds of sense, because the study indicated problems existed. Other times, we’ve seen stations with extremely healthy perceptual profiles go through extraordinary ratings slumps. Because we had a line of sight to that information, we were able to encourage the station to avoid rash programming decisions, and more often than not, the numbers came back around.
The sheer volume and reliability of research that tells you the “what” in podcasting is extraordinary. As podcasting matures, the medium must start embracing deeper levels of qualitative analytics that explain the “whys” of behavior. It is indeed helpful to learn at what point in an episode listeners tend to leave. But if you don’t know the reason why they’re leaving, you risk making the same kind of dangerous assumptions a radio programmer might make in a bad ratings book.
Podcasters who invest in a deeper understanding of their consumers’ behavior will have the best shot at creating strong, lasting, memorable brands. Now is the time to take the leap.