Tag Archives: Integr8 Research

What Your Sales Team Can Teach You about Song Rotations

This is part two of our discussion on how examining exposures instead of spins will help you hear music rotations the way your listeners hear them.

Our previous post introduced the concept of thinking about how often your listener hears a song on your station (exposures) instead of how often you play it (spin counts). For a typical CHR station in a PPM® market whose P1 listeners spend four hours a week with the station, we showed how spinning a song 45 times a week would only result in 1.07 exposures a week for the station’s typical P1 listener.

You’ve been using benchmarks for spin counts for years, however. How should you think about exposures?

While it might be a strange metric for programmers, your station’s sales department has been using this metric for decades. They call it frequency—and for years the rule of thumb has been that an individual listener needs to hear a commercial at least three times a week in order to remember the commercial, otherwise, the brain simply doesn’t register hearing it enough to remember the message.

That means a typical CHR, whose P1 listeners spend four hours a week with the station on average, would need to spin a song 126 times a week for a typical P1 listener to hear the song three times a week on the station.

This three exposures a week benchmark may not apply to songs. After all, your listeners hopefully find your music more compelling than your commercials. So while we’re not suggesting CHR outlets should spin currents 126 times a week, this example does explain why a new song with 45 spins a week still isn’t becoming familiar in your callout research overnight, especially if you’re the only station in town playing it: Even your P1s are only hearing it once a week on your station: By the time listeners hear the song a second time, they’ve already forgotten hearing it the first time.

Examining exposures also explains why the 300-spin rule so many programmers heard years ago about familiarity in new music research isn’t a reliable benchmark today, especially if those spins are stretched out over many weeks.

In a future post, we’ll explore what we’ve learned through our Integr8 New Music Research about what factors makes songs become familiar hits. In the meantime, try using this formula to calculate exposures for some of your categories to get a sense of how often your P1 listeners* actually hear those songs:

Exposures = Weekly TSL x (Spins / 168)

*We recommend calculating this figure among your P1 listeners instead of your broader Weekly Cume audience because your Cume audience includes people who are exposed to your station, but didn’t actively choose to listen to it, thereby spending far less time with you than the typical fan of your station. To understand exposures among lighter listeners, plug in your Weekly TSL among P2 listeners.

PPM, PD Advantage and Tapscan are trademarks of Nielsen, Inc.

How Often Do Listeners Hear Your Hits?

This is the first part of our discussion on how examining exposures instead of spins will help you hear your music rotations the way your listeners hear them.

“We play that song all the time,” the sales manager complains. You assure him it’s a huge hit, but deep down, do you wonder if you are giving that song the ideal number of spins?

Some of the most common questions our Integr8 New Music Research clients ask are about spin counts. In addition to wrestling with how often to play particular titles, programmers also want to know how many spins it takes for a song to become familiar—and ultimately to become a hit—with their audience.

Spin count is such a time-honored measure that we hardly stop to think about it.  However, spins are a classic case of inside thinking; viewing your radio station from the programming perspective rather than from your listener’s perspective. You have 168 hours to program each week, but even a loyal P1 listener only spends a few of those hours with you.

Instead of asking, “How many times per week should I play a song?” you should instead start asking, “How many times per week should my listener hear a song on my station? In other words, instead of looking at station spins, you should be examining listener exposures.

What’s the difference between spins and exposures?

  • Let’s say you spin a brand new release 45 times a week. That means (ignoring dayparting) your station plays that song about every 3 hours and 44 minutes.
  • Now, let’s say your typical P1 listener* listens to your station about 4 hours a week, a typical figure for Weekly TSL among P1 listeners for successful CHR stations in PPM®
  • Since your station plays the song every 3 hours and 44 minutes, and since your typical P1 spends 4 hours a week with you, that means your typical P1 listener has 1.07 exposures a week to that song on your station. Even with 45 spins a week, your typical P1 listener only hears that song about once a week on your station.

What about songs in your power category? Ninety (90) spins a week (a rotation of 1 hour and 52 minutes) only gets you 2.14 weekly exposures with a typical P1 listener.

What about your P2 listeners?

  • A typical CHR P2 listener in a PPM market might spend about 2 hours per week with the station.
  • Therefore, a P2 would have 0.54 exposures to that new song you spin 45 times per week, meaning that a P2 listener would only hear the song on average once every 13 days.
  • For the Power you spin 90 times, a typical P2 would only have 1.07 exposures to that song, which means your P2s would only hear your Powers about once a week.

Right away, you can see that while you feel you’re playing a song a lot—especially when your hard-core listeners complain on your request line and on social media that you play the same songs over and over—the majority of your listeners are not actually hearing that song all the time. While it’s true that listeners might also hear the song on other stations (and increasingly from other music sources), exposures from your P1 listeners’ P2 and P3 stations likely aren’t adding dramatically to their total exposure to any given song.

You can easily calculate exposure for any song on your station and it will only require some foggy memories of high school algebra: Simply look up your Weekly TSL among your P1 listeners* in PD Advantage or Tapscan, then use this formula:

          Exposures = Weekly TSL x (Spins / 168)

“That’s nice to know,” you say, “but how should I think about exposure?”

We’ll tackle that topic in our next blog post.

*We recommend calculating this figure among your P1 listeners instead of your broader Weekly Cume audience because your Cume audience includes people who are exposed to your station, but didn’t actively choose to listen to it, thereby spending far less time with you than the typical fan of your station. To understand exposures among lighter listeners, plug in your Weekly TSL among P2 listeners.

PPM, PD Advantage and Tapscan are trademarks of Nielsen, Inc.

Why Country Creates a Different Bond than CHR

This is the final post in a three part series examining the differences between Country and CHR.

In our previous post, we examined streaming and new music research data to show how Recurrents play a bigger role in Country than in CHR. Now let’s examine what’s at the heart of this difference—the nature of the emotional bonds listeners form with their favorite music.

Country listeners relate to the story, not the moment. 

Why is it that that only 5% of the Top 10 most streamed CHR songs are 45+ weeks old but 18% of the Top 10 most streamed Country songs are 45+ old? Why do Country fans continue to love certain songs for so long after they’re new when CHR fans have long ago moved on?

The difference lies in why listeners connect with songs in the first place.

Listeners tune in to CHR to connect with the music of the moment. Think about CHR’s biggest songs of the summer of the past few years, from “California Gurls” and “Call Me Maybe” to “Fancy” and “See You Again,” these songs weren’t simply unescapable—these songs defined their respective summers. Once summer is over and September settles in, however, these song are no longer relevant to listeners and they tank in Callout.

pop

In contrast, Country’s biggest hits aren’t “of the moment.” They tell stories and speak to emotions that are deeply personal. Listeners who fall in love with specific Country songs relate to those stories and emotions for an entire season of their lives. Listeners might not want to hear these songs as frequently as they did when they were new, but the emotional connection to these songs remains relevant for years, not months.

That country fans connect emotionally to the stories in the songs is certainly not news. What’s lost, however, is that this connection with the music makes recurrents an essential element of Country radio. You can make a CHR sound “hotter” by dropping the recurrents to make way for more current spins. In Country, the power recurrents are a key element, even for stations emphasizing new country. Successful new country flanking attacks work because those stations had the guts to drop the Gold superstars of country’s previous wave. (Sorry, Brad Paisley.) They also bring CHR energy and youthfulness into the station’s personalities, imaging and promotions.

For stations with custom new music research, that’s why these huge Country hits will remain among your best-testing titles instead of dropping as most CHR songs eventually do. That’s also why, even for those older titles that some listeners are getting tired of hearing, burn scores can be half what you’d expect for the most-burned CHR titles.

Bottom Line: Recurrents play a larger role in Country than they do at CHR because the biggest Country hits connect with timeless stories and emotions, not because they’re of the moment.

Want to learn even more about how country listeners consume new music? Watch our webinar Why Country Isn’t CHR. We’ll show you what Country fans’ streaming behavior can teach you about picking new music for your station, how to use sales data to separate the hits from the stuffs and why radio remains vital to exposing Country fans to new music.

Why Recurrents Are More Important to Country Than CHR

This is the second in a three part series examining the differences between Country and CHR.

In our last post, we examined Country listeners’ streaming habits to show how new Country hits take longer to grow, peak and decline than CHR’s big hits typically do. What happens after a big hit’s initial run as a Current and it becomes a Recurrent? Listeners’ streaming behavior reveals another key difference between Country and CHR:

Country listeners have an appetite for recurrents that CHR listeners don’t.

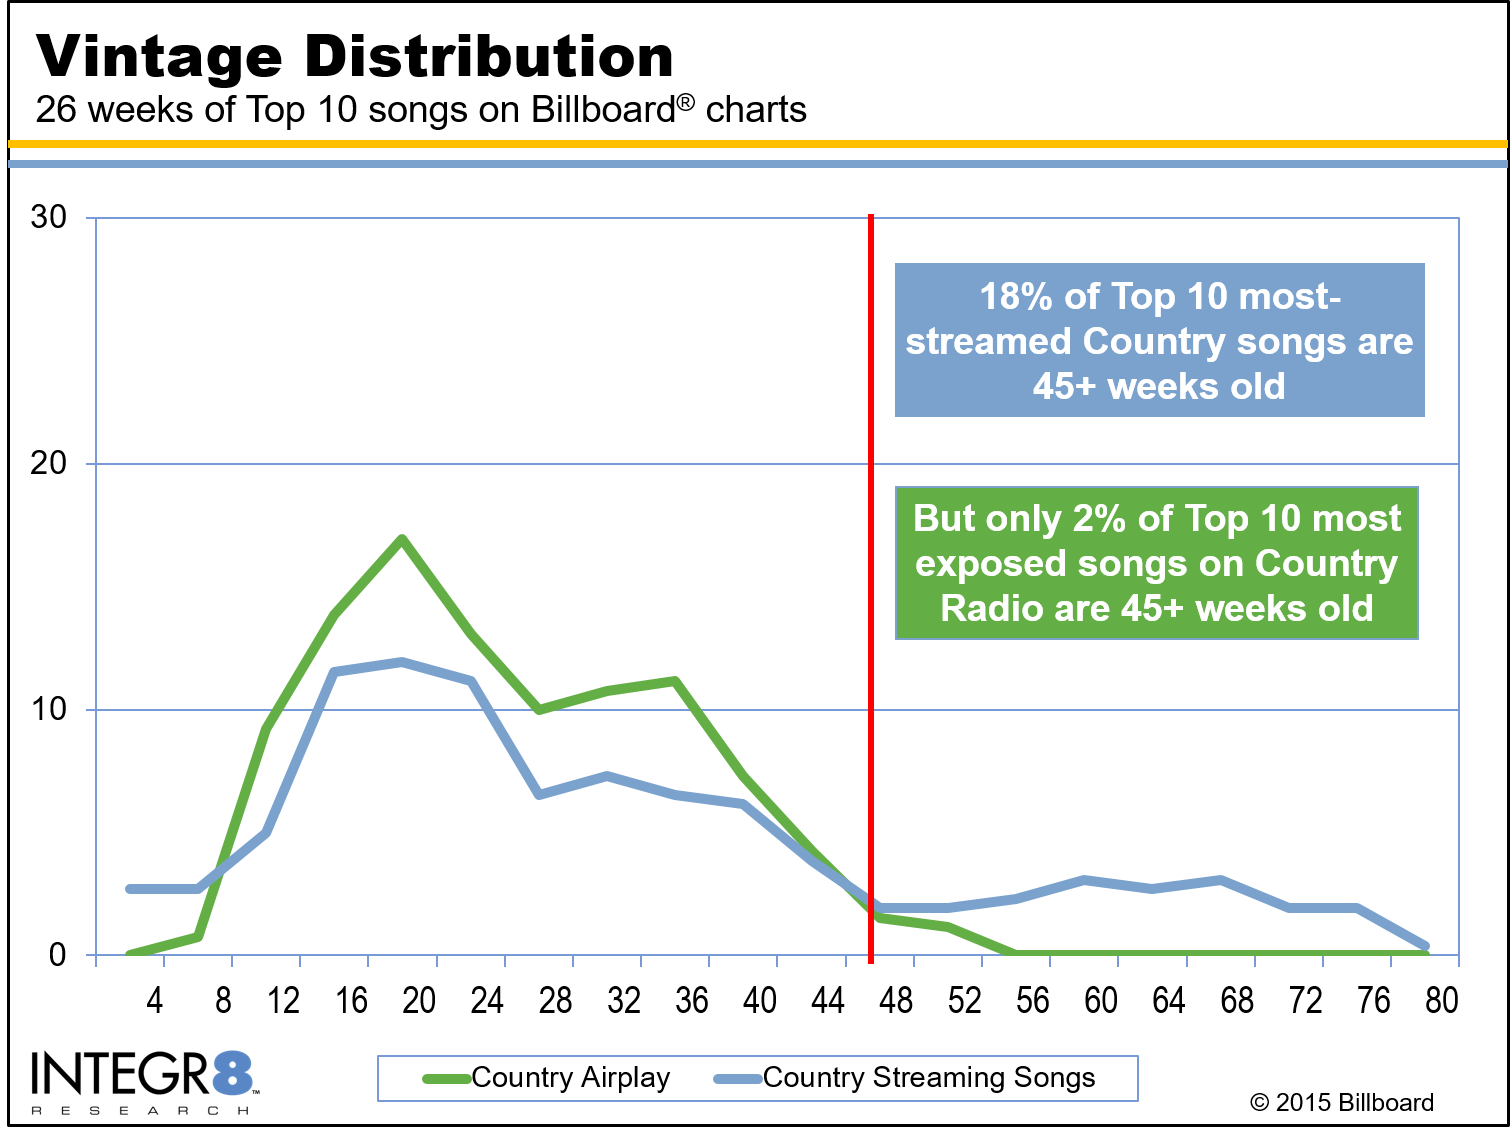
For the first 44 weeks of a song’s life, the vintage of the new music listeners hear on the radio closely mirrors what they play for themselves on streaming services.  However, there is a select batch of Country super hits that remain Top 10 in streaming far longer than they remain currents on Country radio. Eighteen percent (18%) of the Top 10 songs on the Country streaming chart are 45 weeks old or older. In comparison, a scant 5% of the Top 10 most streamed CHR songs are 45+ weeks old.

image-3

The songs that remained among the Top 10 most streamed Country songs include huge hits such as Luke Bryan’s “Play It Again” (still Top 10 in streaming at 64 weeks), “This Is How We Roll” from Florida Georgia Line (stayed Top 10 until it was 74 weeks old), and Brantley Gilbert’s “Bottoms Up” (still among the Top 10 most streamed country songs at 83 weeks).

While 18% of the Country songs listeners stream most are 45+ weeks old, a scant 2% of the Top 10 songs in Country radio airplay are 45+ weeks old. That’s because radio has almost always moved songs that are over 44 weeks old to recurrent categories or has stopped playing them entirely.

country-chr-blog-2-integr8-graph-2016-09

Figure 1: The songs listeners hear on Country Radio closely match the vintage of the songs they play on streaming services for songs less than 45 weeks old. 

Are radio programmers making a mistake?

No—and here’s why:  Integr8 New Music Research confirms that, “Play It Again,” “This Is How We Roll” and “Bottoms Up” all remained listener favorites for as long as they remained big in streaming. “Bottoms Up”, for example, was still #1 in popularity at 77 weeks. However, new music research also captures the additional dimension of how many listeners are getting tired of hearing each song—and all three of these songs were among the top five songs listeners were sick of hearing.

While Country has lower burn scores than CHR (often, the most-burned Country songs in our Integr8 New Music Research are only half as burned as our CHR clients’ most burned songs) this combination of strong appeal and high burn indicates that listeners still love these smash hits, but they don’t want to hear them as often as they did when they were current hits.

In other words, these songs are power recurrents.

image-44

So why should radio play these super hits less frequently if they’re still among the Top 10 most streamed Country songs?

  • Haters don’t hurt streaming, but they can hurt radio: For Spotify, it doesn’t matter how many people are tired of song, or even how many people hate a song: How often people who love it play it is the only thing that matters. For radio, playing a song some listeners hate, or a song they simply don’t want to hear as often as they used to, can cause them to tune out your station.
  • Listeners want their Country station to keep them up to date with the latest Country hits. In perceptual research, Country listeners are consistently clear that they want their favorite Country station to keep them up to date with the latest hits. Even if listeners crank up the volume when that year-and-half old song they love comes on, your reputation for playing the latest Country hits can head south if listeners are always hearing last year’s songs when they tune in. In other words, playing listeners tried and true favorites as if they were still currents might not hurt you today, but it could make your station seem stale tomorrow.

Bottom line: Songs that listeners still love after 45 weeks should be in your power recurrents.

Our next post will showcase the difference in how Country and CHR listeners emotionally connect with their favorite music, and how understand this difference will help you make better new music decisions.


Why Country Isn’t CHR

This is the first in a three part series examining the differences between Country and CHR.

A lot of programmers who built their careers in CHR have made the move to Country. Bringing CHR-style imaging, engaging promotions and fresh personalities has helped Country stations topple heritage competitors, reinvigorate brands and attract younger listeners since the 80s.

But if you’re one of those CHR pros now programming Country, does it make sense to approach your new music the same way you would for CHR? Do Country listeners warm up to new music and get tired of hearing the biggest hits the same way CHR listeners do?

Last year, we examined how listeners consume new music in the CHR universe when they control the music they hear on streaming services such as Spotify and YouTube. Now, we examine how Country fans consume new music. Specifically, we analyzed 26 consecutive weeks of Billboard Top 10 Country Streaming Songs Chart (from March 28th, 2015 through September 19th, 2015) to determine the age of the Country songs listeners play most when they pick which songs they hear. We then pegged each song’s vintage to when it first entered any of Billboard’s Country charts, so that we can see when each song first entered the public consciousness, not when the record company released it.

What did we learn? If you treat Country as if it’s CHR from Nashville, you’re making a mistake.

It typically takes 13 weeks for Country listeners to warm up to a new song.

That’s a slower warm up time than CHR, where it typically takes eight weeks for a song to become a Top 10 most streamed song. Eric Church’s “Like a Wrecking Ball” took 13 weeks to become a Top 10 hit on the Country streaming chart. Blake Shelton’s “Sangria” took 14 weeks. “Buy Me a Boat” from Chris Janson took 20 weeks to work its way up to the Top 10 most streamed Country songs list.

country-isnt-chr-1

Sure, there are some songs that become big hits faster. Luke Bryan’s “Strip It Down” and “Kick the Dust Up” both hit Top 10 in streaming after only four weeks. Keith Urban’s “John Cougar, John Deere, John 3:16” and Thomas Rhett’s “Crash and Burn” took only eight weeks. For most songs, however, if you’re used to CHR, you need to slow down your timeframe to match your audience’s speed—your listeners typically need 13 weeks to warm up to new songs.

Bottom line: If you’re giving up on new songs before 13 weeks, you’re not giving them enough time to grow.

Country listeners typically want to keep hearing the big hits for 28 to 44 weeks 

In CHR, listeners are typically sick of songs once they’re between 20- and 28-weeks-old. That’s when listeners generally stop playing CHR hits on Spotify and YouTube. That’s also when the Integr8 New Music Research Hitcycle® measure shows listeners think most CHR songs are past their prime. In CHR, moving songs out of currents once they’re 26 weeks old is generally the right move. In Country, however, that’s exactly when listeners are typically most into hit songs. Fifty five percent (55%) of the Top 10 most streamed Country songs are between 13- and 36-weeks-old. In comparison, the majority of the Top 10 most streamed songs in CHR are 8- to 24-weeks-old.   

country-isnt-chr-2  

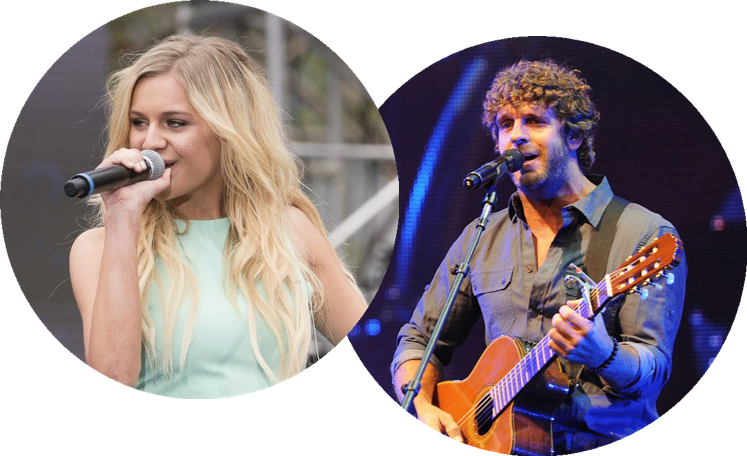
“Like A Wrecking Ball” by Eric Church didn’t drop out of the Top 10 Country streaming chart until it was 31 weeks old. Billy Currington’s “Don’t It” stayed Top 10 until it was 39 weeks old. Kelsea Ballerini’s “Love Me Like You Mean It” was Top 10 all the way until its 42nd week on the charts.

Bottom line: If you’re automatically moving Country songs out of your current categories at 26 weeks, you’re moving songs when listeners still want to hear them a lot. Most Country songs stay Top 10 until 28 to 44 weeks.

In our next CHR vs. Country blog post, we’ll examine another key difference between the two; the role of recurrents.

Three Things You Need to Know About Pandora’s Charts

Unlike Spotify and YouTube, who have shared their spin counts with the Nielsen-powered Billboard charts for years, Pandora has been uniquely secretive about the songs they spin most. However, starting in August, the internet radio juggernaut finally started sharing information about the songs and artists they play with three different charts:

  • The Pandora Trendsetters Chart shows the top 20 new artists used by listeners to start new Pandora stations during the past week. However, once Pandora considers an artist “established” based on their social and streaming activity, they no longer include that artist on the Trendsetters Chart.
  • The Pandora Predictions Chart shows songs that are receiving social media references and increased Pandora spins, but have not yet reached any Billboard charts. The Predictions Chart is a similar concept to Billboard’s “bubbling under” chart.
  • The Pandora Top Spins Chart shows the 100 tracks that have been spun the most times over the past week, reflecting which songs are currently the most popular. For most radio programmers, the Top Spins Chart is the most relevant of these three charts because it most closely mirrors tools such as Mediabase airplay, Spotify, Shazam, the Billboard Hot 100 chart, and custom callout research that programmers rely on for information about which songs are most popular with listeners.

Before you dive into Pandora’s data, there are three key things to understand about their Top Spins Chart:

1) Pandora automatically drops most songs off their Top Spins Chart after 16 weeks—which means half the hits are missing.

Regardless of how popular a song still is, Pandora categorically drops most songs from its Top Spins Chart after 16 weeks. They do allow rare exceptions if a song is on a “hot streak,” which they define as any song they believe has not yet reached its peak spin count. This policy is similar to how Mediabase and Nielsen BDS move songs from “Current” to “Recurrent”, but unlike these services, Pandora doesn’t show you the recurrents.

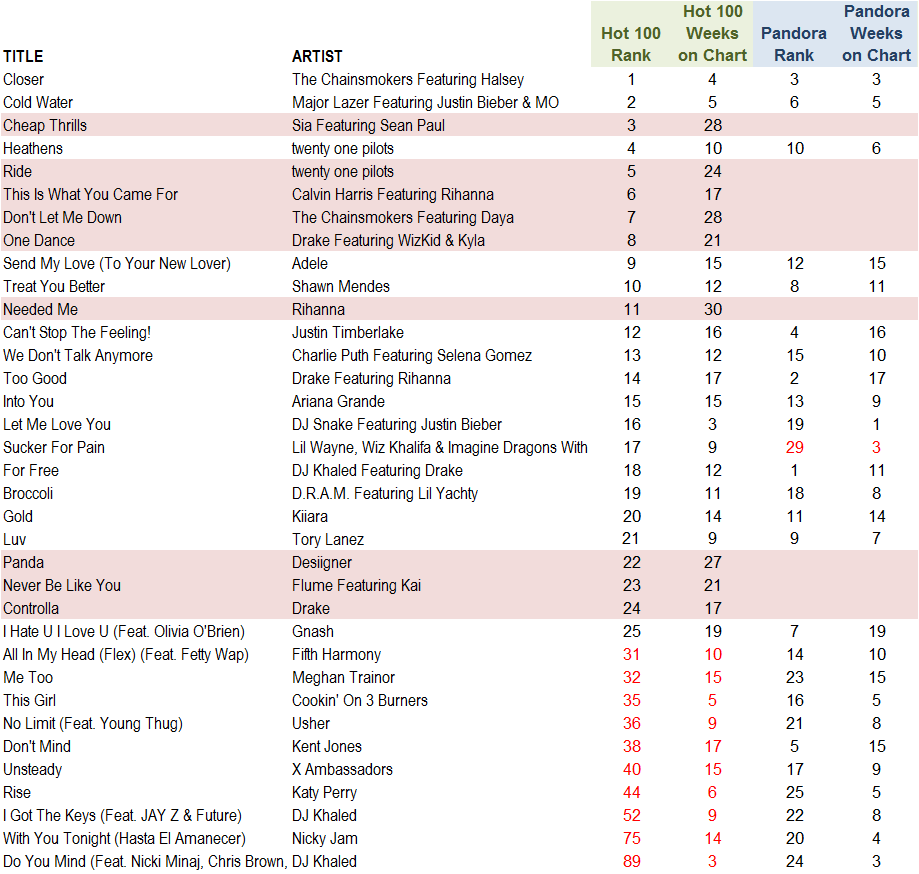
Why does this policy matter?  Almost half of the 10 hottest songs on the Hot 100 in a typical week are older than 16 weeks. Many of the biggest Top 10 hits on radio and on other streaming services are typically up to 28 weeks old. Assuming Pandora’s listeners are typical new music consumers, Pandora’s Top Spins Chart is likely missing half of the songs that really get played most on Pandora. This week, those missing songs include the following Top 10 hits on the Billboard Hot 100:

  • “Cheap Thrills” by Sia featuring Sean Paul
  • “Ride” by twenty one pilots
  • “This Is What You Came For” by Calvin Harris featuring Rihanna (This song was #1 on Pandora’s Top Spins Chart last week, but vanished this week due to the 16-week drop policy)
  • “Don’t Let Me Down” by The Chainsmokers featuring Daya
  • “One Dance” by Drake featuring WizKid & Kyla

Pandora has this policy, “to ensure that the chart is not altogether static.” That’s perplexing, because other charts that don’t arbitrarily drop songs certainly change over time. Pandora has come under fire from record labels for not exposing its users to new music as rapidly as other sources, so this policy might be an attempt to counter that critique. Unless Pandora users predominantly use the service to hear gold titles, the Top Spins Chart without the drop policy chart would not be static either.

Arguably, this chart’s name is misleading: What you’re really seeing is the biggest hits that are still growing on Pandora, not which songs are, in fact, their top spins.

2) “Thumbs Up” and “Thumbs Down” has no impact on Pandora’s Top Spins Chart.                                                                                                                                                                            A song counts as a play on the Pandora Top Spins Chart regardless of how long the listener played the song. That means if Pandora offers a song to a listener, it counts on the Top Spins Chart, even if the listener immediately skips or thumbs down the track. While hitting “thumbs up” on a song means Pandora will play it more frequently, thumbs ups don’t directly impact a song’s chart performance, either.

To a degree, Pandora’s Top Spins Chart shows which songs Pandora thinks listeners will like, not necessarily which songs they actually do like. In that regard, the chart is similar to radio airplay charts: For some titles, they reflect which songs program directors think listeners will like, not necessarily which titles the station’s new music research ultimately shows listeners do like.

3) Songs on the Top Spins Chart represent up to 10-million plays.                                                                                                                                                                                                   Unlike Mediabase and Nielsen BDS, Pandora’s Top Spins chart doesn’t show the exact number of spins for each song. Pandora has stated that the songs from #100 to #1 on the Top Spins chart received between 1.5 and 10 million plays during the past week.

Since Pandora is a personalized service, there is no equivalent metric in radio. Spins aren’t comparable, since tens of thousands of listeners hear a song each time a leading major market station spins it. Audience Reach isn’t equivalent, either, since it shows the number of listeners who heard a song this week, regardless of how many times each listener hears it. Although not directly comparable, it’s worth noting that while Pandora’s top song gets played about 10-million times, the biggest songs on terrestrial radio each week reach well over 150-million people in the U.S.

With this knowledge in mind, how should you use Pandora’s Top Spins Chart as a tool for evaluating new music for your station?

  • Expect that up to half of the biggest hits each week will be missing from Pandora’s Top Spins Chart because of their 16-week drop policy. Don’t assume that listeners no longer want to hear a song on Pandora or on your radio station simply because it no longer appears on Pandora’s chart, especially if other measures show it’s still popular.
  • Use Pandora’s Top Spins Chart to spot hits you might be missing. While Pandora’s chart can’t tell you how long big hits remain popular, it can be a great source to spot new songs that are catching on with Pandora users before they’re catching on elsewhere. Given that Pandora’s audience dwarfs the listenership of other streaming services, knowing a song is a breakout hit on Pandora can be valuable information.
  • Before adding a song that’s big on Pandora, assess whether your listeners might react negatively to it. Pandora’s Top Spins Chart shows what they played regardless of whether or not listeners hit “thumbs up” or “thumbs down.” While users’ thumb activity will ultimately reflect what Pandora plays, songs could appear on the Top Spins Chart that a lot of their users actually hate.

pandora blog image 2016 09

Comparison of the Pandora Top Spins Chart with the Billboard Hot 100 chart. Half of the Top 10 hits are missing from Pandora’s chart because of their 16-week drop policy. © 2016 Billboard, © 2016 Next Big Sound

For more things to consider when reviewing how songs perform on streaming services, see our articles on How Streaming Data Can Help Radio Pick New Music and The Limitations of Using Streaming Data to Pick New Music.

Three Reasons Today’s Hip Hop is Different Than Yesterday’s

In our last post, we explored the fall and rise of Hip Hop, shown as Hip Hop’s share of the top 10 songs on the Billboard Hot 100 each week.  Although Hip Hop’s appeal has rebounded back to 2008 levels after reaching a low point in 2012, there are three fundamental differences between Hip Hop’s appeal from 2000 to 2012 and Hip Hop’s appeal from 2012 to today.

1. Fewer titles are becoming Top 10 hits, but they’re staying hits longer.

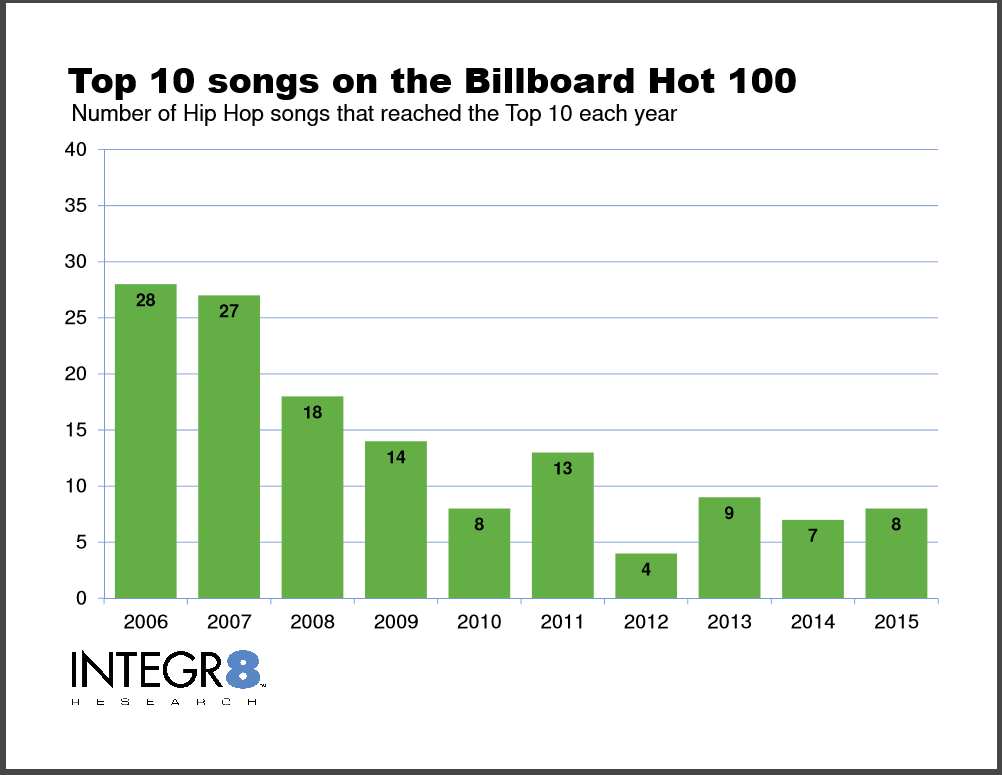
First, far fewer individual Hip Hop titles are actually making it into the Billboard Hot 100’s Top 10 today. In 2006, 28 different Hip Hop titles were Top 10 hits, but on average, these songs remained in the Top 10 for seven weeks. In 2015, only eight reached the Top 10. However, those eight songs that did reach the Top 10 remained there for 13 weeks on average. Fetty Wap’s “Trap Queen” stayed in the Hot 100’s Top 10 for 25 weeks. There are fewer Hip Hop songs becoming big hits today, but the songs that do make it have much stronger staying power than the Hip Hop hits from a few years ago.

three reason graph 1

Figure 1: Number of Hip Hop songs that reached the Top 10 each year 

2. Even fewer artists have big Hip Hop hits today.

Second, far fewer Hip Hop artists are scoring Top 10 hits on the Billboard Hot 100. From 2005 through 2011, a wide variety of artists, including Ludacris, Nelly, Flo Rida, T-Pain, Usher, Lil Wayne, T.I., Jay-Z, Drake, and Wiz Khalifa accounted for Hip Hop’s biggest hits each year.

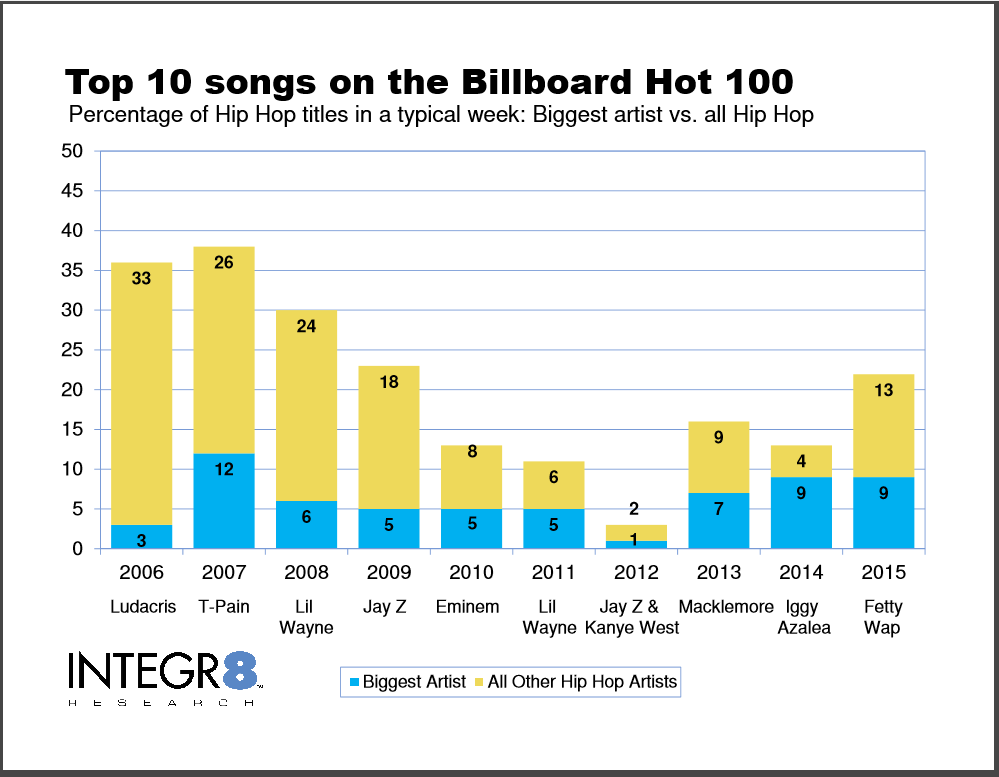
In 2013, however, almost half of the Top 10 Hip Hop hits during a typical week were from only one artist: Macklemore. Not only was the year’s biggest Hip Hop hit by a Caucasian from Seattle, “Thrift Shop” blatantly mocked the materialistic, big-spending lifestyle celebrated in Hip Hop’s biggest hits of the previous decade.

In 2014, a whopping 71% of Hip Hop’s time in the Top 10 came from one Australian artist who learned to rap from a native of Atlanta: Iggy Azalea’s “Fancy,” “Problem,” and “Black Widow,” spent a combined 46 weeks in the Top 10 of the Billboard Hot 100 chart.  In comparison, Chris Brown and Lil Wayne only managed two weeks.

In 2015, while Hip Hop’s share of the Top 10 on a typical week rose, 41% of Hip Hop’s time in the Top 10 came from Fetty Wap’s three hits last year.

This change from a variety of artists with a library of hits to only a handful of artists with a small number of specific hits has benefitted Mainstream CHRs more than many Rhythmic CHRs for whom historically Hip Hop was a core sound.  There aren’t as many second-tier Hip Hop hits with general market appeal for a Rhythmic CHR to play prominently in regular rotation, while the biggest Hip Hop hits are so big, mainstream CHR outlets often get the perceptual credit for playing them.

For Rhythmic CHR outlets that depend on general market ratings success, balancing playing the biggest current hits with playing the songs that listeners perceive make the station uniquely different than the mainstream CHR is more critical and challenging than ever. Some stations will find it’s better to err on the side of playing more pop and dance hits instead of Hip Hop. Other Rhythmic CHRs will be better off dipping deeper into urban material to stay true to listeners’ expectations of the brand. That strategic decision depends on the competitive situation and market composition for each individual Rhythmic CHR. With fewer Hip Hop titles and artists enjoying mass appeal, following the Rhythmic CHR formulas that worked a decade ago isn’t an option today.

three reason graph 2

Figure 2: Percentage of Hip Hop titles in a typical week for the year’s biggest Hip Hop artist vs. all Hip Hop titles in the Top 10 in a typical week

3. Hip Hop is no longer an isolated genre.

Third, unlike a decade ago, today’s young hit music consumers don’t see Hip Hop as a separate and isolated genre, but rather as another popular style that can be blended in songs with others like pop and EDM.

Take “See You Again” from Wiz Khalifa featuring Charlie Puth, which was 2015’s second biggest Hip Hop hit. It combines Rap with a love song chorus so smooth you’d think it was written for Delilah. We didn’t even count Taylor Swift’s “Bad Blood” as Hip Hop in our analysis, since the Hot AC version didn’t include Kendrick Lamar, but 2015’s CHR listeners didn’t bat an eye at the pairing. Can you imagine Shania Twain and P Diddy recording together in 1999?

2016 continues the trend of Hip Hop becoming a stylistic component of hit songs rather than a distinct genre. Rihanna and Drake both had Hip Hop and non-Hip Hop hits, most notably their joint effort “Work.” Some songs we categorized as Hip Hop, such as G-Eazy and Bebe Rexha’s “Me, Myself & I” or “One Dance” from Drake featuring Wizkid and Kyla, could just as easily been counted as Dance or R&B hits.

For Urban Contemporary radio, Hip Hop remains a distinct genre with big hits by a new generation of stars, from Fetty Wap and Schoolboy Q to Desiigner and Bryson Tiller.  However, among general market audiences, this pure Hip Hop is highly polarizing: Some listeners love it, but as we see in our Integr8 New Music Research for CHR clients, a significant number of listeners also hate this kind of Hip Hop.

In contrast, the Hip Hop tracks that have become huge mainstream hits since 2012 have largely been songs that break down the barriers that traditionally defined Hip Hop, whether it be the background of the performers, the mixing of musical styles or the lyrical content of the song.  No, Hip Hop didn’t die in 2012.  However, the assumptions we used to make about what defines Hip Hop should.


The Fall and Rise of Hip Hop

In 2012, a flurry of articles began appearing in the music press asking, “Is Hip Hop dead?” Most articles simply bemoaned the lack of authenticity of the genre’s good old days, or complained it was becoming “too white,” but a few articles actually cited data.  Did you know not a single African-American artist hit #1 on the Billboard Hot 100 chart in 2012, or that no Hip Hop song reached #1 for almost two years between 2011 and 2013?

For our Integr8 New Music Research clients that target predominantly African-American audiences, Hip Hop continued to test well. However, our Rhythmic CHRs that target Caucasian and Hispanic listeners were frustrated at the lack of Hip Hop hits with crossover appeal among their general market audiences. Crossover Hip Hop, after all, is what made the format different from mainstream CHR in the first place.

Did Hip Hop really die in 2012?

To find out, we examined every song that became a Top 10 hit on the Billboard Hot 100 chart from January 2006 to June 2016. (By examining the Hot 100, we can examine all the ways listeners consume music on a broad nationwide basis, instead of the tightly tailored local radio audiences we track for individual stations in our Integr8 New Music Research.) We then had our team of music experts code each song to determine how many of those Top 10 hits were Hip Hop, both the Pure Hip Hop tracks typically only found on Urban radio by artists such as Lil Wayne, T.I., Jay Z and Future, as well as those Pop Hip Hop songs that usually become Mainstream CHR hits from artists like Drake, Nelly, Flo Rida and Wiz Khalifa.

Here’s what we uncovered:

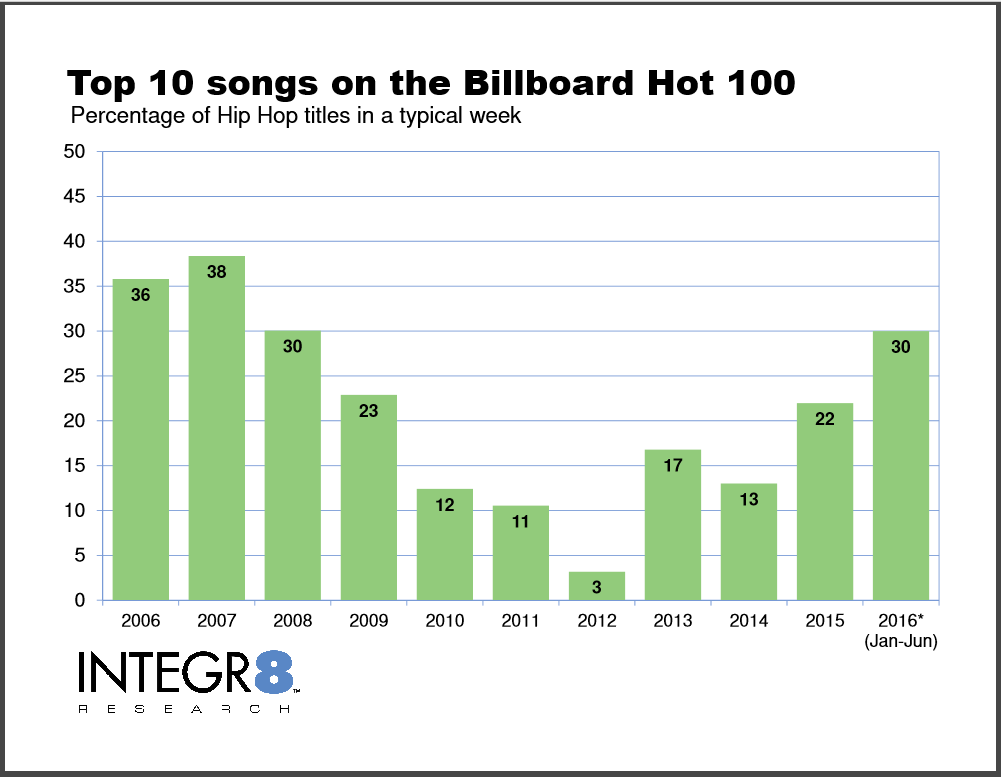
  • In 2007, when Mims “This Is Why I’m Hot”, and “Buy U a Drank” from T-Pain featuring Yung Joc shared the Top 10 with Fergie and Plain White T’s—Hip Hop accounted for 38% of all Top 10 hits in a typical week.
  • Fast forward to 2012, when Carly Rae Jepsen’s “Call Me Maybe” and Gotye’s “Somebody That I Used to Know” were inescapable chart-toppers, a scant 3% of Top 10 hits in a typical week were Hip Hop.

No wonder 2012 was the year music critics wrote Hip Hop’s eulogy.


However, as Mark Twain famously quipped, “The reports of my death have been greatly exaggerated.”

  • In 2013, Hip Hop titles rebounded to comprise 17% of the Top 10 in a typical week.
  • In 2014, Hip Hop’s share of the Hot 100’s Top 10 in a typical week sank slightly to 13%.
  • By 2015, Hip Hop rebounded to 22% of the Top 10 in a typical week in 2015. While still well below the genre’s appeal a decade ago, it’s still comparable to 2009 when Hip Hop’s fate was not yet in question.
  • So far in 2016, Hip Hop accounts for 30% of the Top 10 in a given week, putting Hip Hop’s share of the biggest hits back to 2008 levels.

fall and rise blog 1 graph

However, there are three fundamental differences between Hip Hop’s chart performance before and after 2012.  We’ll explore why today’s Hip Hop hits aren’t the same as yesterday’s in our next post.

Figure 1: Percentage of Hip Hop titles in a typical week in the Top 10 on the Billboard Hot 100.


The Limitations of Using Streaming Data to Pick New Music

In our last post, we outlined three reasons you should examine streaming data to help pick new music. Before fully embracing streaming data as a new secret weapon, here are five limits to what you can learn from streaming:

1) Streaming data only shows the positive, not the negative. There is a fundamental difference between radio listenership and on-demand listening that’s easy to overlook:  In radio, playing a song people hate hurts you because it can cause listeners to turn off your station. For on-demand streaming, however, haters have no impact—all that matters is how many people love a song enough to play it. Idina Menzel’s “Let It Go” was a #2 smash on streaming in 2014, but went nowhere on radio (much to the relief of Frozen weary parents everywhere). Silento’s “Watch Me” was the #3 most streamed song in 2015, but didn’t even make the Top 75 in radio airplay. In contrast, a song like Walk The Moon’s “Shut Up And Dance” was #2 in radio airplay in 2015 but only #31 in streaming: Fewer people might love “Shut Up And Dance” enough to play it repeatedly on YouTube, but enough people do enjoy hearing it when they happen to come across it and relatively few hate it, so it was a successful radio song. In streaming, you can have a huge hit with a song many dislike. In radio, however, ignoring the haters can cost you listeners.

2) Streaming data sometimes misses when people are getting sick of a song: In theory, when listeners are sick of a song, they stop streaming it. While this theory often holds true for CHR hits, there are other cases where songs remain among the most-streamed songs even though a lot of people are burned out on them. This phenomenon is particularly acute in Country, where a select few megahits remain relevant with listeners months and even years after they’re new. Sam Hunt’s “Leave The Night On”, Luke Bryan’s “Play It Again”, and Brantley Gilbert’s “Bottoms Up” remained among the Top 10 most streamed Country songs for well over a year. While many listeners did indeed still love these titles, Country stations with custom new music research knew that listeners were also burnt out on these songs. Stations wisely kept airing these titles, but as recurrents, not currents. Even in the pop music realm, novelty songs, songs people stream for the video, and songs popular with young children remain strong in streaming long after many people are sick of them.

3) Streaming data doesn’t tell you if a lot of people are playing a song, or if a few people are playing it over and over and over.  Streaming data doesn’t tell you how many people like a song—it tells you how often a song gets played. Ten listeners playing a song once count the same as one person playing that song 10 times. Anyone who has a young child knows how obsessed they can become with a song.  Was Silento’s “Watch Me” the third most streamed song in 2015 because a lot of people love it, or because eight-year-olds played it over and over and over? (I’m pretty sure my daughter single-handedly got “Let It Go” in the Top 10 back during the height of “Frozen”). In radio, however, we need songs that lots of people like, not just songs a few people passionately want to hear repeatedly.

4) Streaming data isn’t inherently ahead of the curve. There are a few cases where songs become hits on streaming before they’re on radio’s radar. In 2015, Fetty Wap’s “Trap Queen” broke on streaming before radio fully caught on. In 2014, Tove Lo’s “Habits (Stay High)” broke on Spotify months before radio embraced it. These songs, however, are the exception, not the rule. Overall, the typical Top 10 biggest songs on the radio are between 9- and 20-weeks-old. In comparison, the Top 10 biggest songs on the on-demand streaming services are also between 9- and 20-weeks-old. While this fact is an advantage for determining what songs listeners like most right now, it doesn’t provide an early read on songs’ hit potential.

5) Streaming data is subject to record labels’ launch strategies. Why do Taylor Swift songs not rank as highly in streaming as they do in airplay? Because her record label famously pulled her material off Spotify. Since labels would rather sell CDs than earn streaming royalties, withholding on-demand access to superstar artists is a strategy they employ to maximize revenue. Labels are increasingly allowing new releases to on-demand subscription customers before allowing ad-driven “freemium” customers to hear them. The labels call it “windowing”. It’s designed to force consumers to pay a premium for access to brand new music. For up and coming artists on the other hand, some labels intentionally try to break a song on Spotify to create a buzz about it before pitching it to radio. That’s how Tove Lo’s “Habits (Stay High)” got noticed. Without knowledge of the label’s windowing strategy, a song can appear more popular or less popular than it actually is. Unlike Taylor Swift’s highly publicized pullout on Spotify, most songs’ windowing strategies don’t make front page news.

While it’s important to keep these five limitations in mind, the additional information examining streaming data can provide about which songs listeners are playing most when they’re in control of their music makes streaming a valuable tool to have in your toolbox. When you examine streaming alongside sales, Shazam, MScore, airplay on similar stations, and your own new music research, you’ll have a complete picture of how your listeners are engaging with new music.

Where to find streaming data

Streaming data is compiled by Nielsen and published each week in the Streaming Songs chart, which includes a wide variety of audio and video streaming services such as YouTube, Spotify and Slacker (but not Pandora), and the On-Demand chart, which focuses on audio-only on-demand services such as Spotify.  You can access these charts at Billboard.com or from the Nielsen’s BDSRadio service.