Anytime we conduct a research study, our favorite notification email is the one that reads, “The sums for your project have been delivered and can now be found in your brief.”
Like a kid opening presents on Christmas, that email is an invitation from Santa to go to a folder on our server, open a spreadsheet, and dive into mounds and mounds of data.
Research isn’t for everyone, but if that gives you a thrill, the business may be for you.
When analyzing the data for the recent research study we conducted with Amplifi Media, “The New Rules of Podcasting on YouTube,” as we do with all studies, we’re looking for a story. What does the data tell us? What does it mean? And how can we turn it into action to produce strategic results?
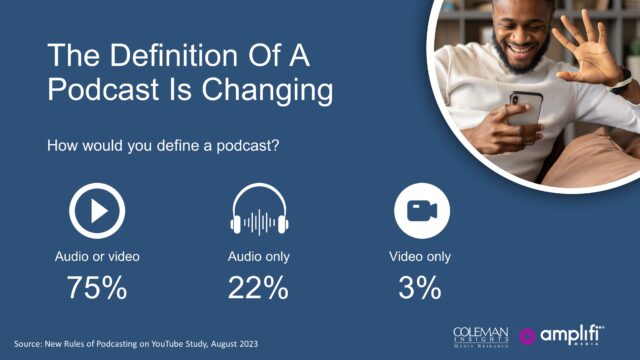
In this study, the big story is that the definition of “podcast” and how people consume podcasts is shifting, big time. Consumers now define podcasts as audio or video, not just audio. They like YouTube for podcasts. I mean, really like YouTube. What we learned from those who use YouTube to consume podcasts uncovered actionable findings that can help podcasters formulate their video strategies.

But wait, there’s more!
That spreadsheet with multiple crosstabs, or “data tables” as we refer to it, lists every question asked in the study and the corresponding answer overall. But we’re also analyzing answers by things like age, gender, ethnicity, and geography. We want to see how questions are answered by users of specific podcast platforms or fans of specific categories. How different are the answers by how often they consume podcasts? This is an example of just some of the digging we do.
If we showed every piece of data, the presentation would go on for days. And different pieces of data may be more interesting to different people.
If you work in radio, we’ve got data that shows how listeners of local radio stations feel about podcasting and the role of video. We’ve got data on users of many streaming services, including Netflix, Hulu, Disney+, Paramount +, and Max.
If you work in marketing or advertising, you may find it interesting how podcast consumers say they’re discovering new podcasts.
We’ve got “momentum” data – which platforms are moving up and down in usage vs. last year. We know which podcasts consumers say are their favorites and can look at that data across other measures.
If you’re interested in purchasing additional data from “The New Rules of Podcasting on YouTube,” click here and fill out the form. Multiple levels of access are available at different price points, and we’d love to discuss how the data may help you.
