Tag Archives: PPM

Preparing for Daily Radio Ratings

Tuesdays With Coleman

One of my favorite Facebook features is Memories, which allows me to start most days with reminders of life events I shared in years past. A few weeks ago, I woke up to reminders of a great business trip I took across Canada ten years ago.

On that trip, my colleague John Boyne and I delivered breakfast presentations on four consecutive mornings in Vancouver, Calgary, Edmonton and Toronto at the invitation of NLogic (then known as BBM Analytics), the software arm of the Canadian ratings service. Its president asked us to share our early learnings about PPM in the United States just before the audience measurement service was rolled out in his country.

I bring this up because a few weeks ago I had the opportunity to see the “next big thing” when it comes to PPM and, as a result, many of the items John and I covered in those breakfast presentations are worth revisiting.

This “next big thing” is coming this month from Media Monitors and its name says it all: Audio Overnights. Yes, it’s true, after making the leap from quarterlies to monthlies to weeklies, the radio business is about to join the world of “dailies.” This means that after constantly reminding our clients in PPM markets that “It’s only a weekly,” we’re now going to have to hold their hands through the ups and downs they will experience as they download the ratings from yesterday onto their computers.

Media Monitors

I am not going to use this week’s blog to rehash Jon Coleman’s landmark “Top Ten Things to Do as a New PD in a PPM Market” article (although, if you want to remind yourself of its teachings, I invite you to review the piece here), which encapsulated much of the material we covered in our presentations to Canadian broadcasters. Instead, I am going to focus on four of the items in Jon’s article that address the changes most stations see in their PPM performances on a short-term basis.

One of Jon’s ten “things” is the need to understand how PPM works and that it—like all research—is prone to statistical wobble. This will be especially true when we start looking at PPM data on a daily basis, as it will be possible—likely, in fact—that there will be occasions where your audience will grow from Wednesday to Thursday and the daily data will tell you the complete opposite. Thus, it is important not to fixate on individual days; what you must do instead is look for longer-term trends in daily data before you start to raise questions about a station’s performance.

Another point is that while programmers—thanks to some extent to tools that have been introduced by Nielsen Audio in recent years—have a better understanding than they used to of panel dynamics, they will need to recognize that panel behavior will have a huge impact on daily data. We usually talk about panel dynamics in terms of respondents entering and leaving a panel, but when we look at daily data, we will experience the impact of panelists dropping in and out of in-tab daily. You can already envision scenarios where a panelist who is a reliable contributor of quarter-hours of listening to a station experiences a life event that prevents him or her from carrying their meter—or, less dramatically, that causes a break from his or her usual pattern of listening—on a given day and the impact that this will have on the daily numbers.

Portable People Meter

Just as we discourage our clients from obsessing over weekly or even monthly PPM data, we feel this is even more important once Media Monitors delivers Audio Overnights to its customers. Avoid downloading the numbers every day and don’t make an event out of it when you do. Instead, look at a bunch of individual days’ data at the same time and watch for patterns by aggregating the data. Outside of when there was a major event that you would expect to drive a big spike or decline in listening, don’t lose the forest for the trees by hyper-focusing on data for an individual day.

Lastly, evoking one of our favorite philosophies about research, avoid confusing correlation with causation. The former is when your ratings go up or down at the same time as you or a competitor made a change and you incorrectly assume that the numbers reflect the impact of that change. It is only through other research that gives you more insight into the hows and whys of listeners’ behavior that you can connect the two with confidence.

I am not going to pass judgment on the introduction of Audio Overnights; they’re coming and we will be prepared to help our clients interpret the data. With that said, I am confident that programmers who follow the tenets of Outside Thinking and understand how consumers make the decisions about what to listen to when will be the ones who will not obsess over daily data and use the tool correctly as a guide that will help them raise the right questions about their station…and not as an answer for why their stations perform as they do.

Our Top 5 Blog Posts of 2018

Tuesdays With Coleman

Radio loves a good countdown.

WMCA-FM in New York was counting down the hottest singles all the way back in the 1950s.

WMCA-FM Countdown

Casey Kasem took the countdown format coast-to-coast with the debut of American Top 40 in July 1970 (on just seven stations!)

Countdowns have stood the test of time, from syndicated programming to the local “Most Requested,” Top 8 at 8 or Hot 9 at 9.

2018 marks the first full year of our Tuesdays With Coleman blog, providing tips and insights on branding, content and research strategy every Tuesday.

As we get ready to say farewell to 2018, it seems only fitting to highlight our five most-read blogs of the year in honor of the great radio countdowns of past and present.

With the assistance of Google Analytics, we’ve got the facts and figures and the list below (counted down, of course, from number five to number one.) Now, on with the countdown.


#5           Should I Play That Song on my Radio Station?  By Jon Coleman

In this blog, originally posted on September 25, 2018, Founder Jon Coleman explains that deciding which songs to play on your radio station isn’t always as clear as it seems. Jon describes how our Brand-Content MatrixSM and Acceptance-Fit Matrix can assist with your evaluation strategy, and reveals when it makes sense to take some extra risks.

Acceptance Fit Matrix


#4           Why Radio Stations Are Like Toy Stores  By Jay Nachlis

Associate Consultant Jay Nachlis wrote this blog on September 4, 2018, after FAO Schwarz announced the iconic toy brand would reopen in New York.

By revisiting his thoughts on why Toys R Us closed earlier in the year and examining new plans by FAO Schwarz, Jay discovers that the things that make toy stores appealing are strikingly similar to what makes radio stations appealing.

#3           The Branding Genius of Trader Joe’s  By Sam Milkman

While just about every Tuesdays With Coleman blog covers brand strategy, not all focus entirely on radio. This April 3, 2018 entry from Executive Vice President/Senior Consultant Sam Milkman highlights four reasons why Trader Joe’s has succeeded in the hugely competitive grocery space.

If you do work at a radio station, you’ll discover ways to carve out your own market position using lessons from Trader Joe’s.

Trader Joe's Hawaiian Shirts

#2           The 90s Music Research Conundrum  By John Boyne

Executive Vice President/Senior Consultant John Boyne reveals the reason why Adult Contemporary and Classic Hits radio stations are playing such small percentages of 90s music, despite the fact that much of the target demographic grew up listening to it.

#1           10 PPM Tips for Program Directors: 10 Years Later  By Jon Coleman

10 years after Arbitron rolled out the Portable People Meter to the Top 10 US markets, Jon revisits a dos and don’ts list he wrote for radio program directors in the early days of PPM.

This blog republishes the 10 tips, with brand new commentary from Jon looking back at the advice through a 2018 lens.

Arbitron Nielsen Portable People Meter PPM

An early version of Arbitron’s Portable People Meter (PPM)

All of us at Coleman Insights wish you a wonderful holiday and Happy New Year! If you haven’t yet subscribed for Tuesdays With Coleman, click here and you won’t miss a single post in 2019.

“Keep your feet on the ground, and keep reaching for the stars.” – Casey Kasem


10 PPM Tips for Program Directors: 10 Years Later

Tuesdays With Coleman

This Fall marks 10 years since Arbitron rolled out the Portable People Meter™ (PPM™) to the top 10 markets in the United States, following initial tests in Houston and Philadelphia (markets 11-50 rolled out in 2009 and 2010.)

Arbitron Nielsen Portable People Meter PPM

An early version of Arbitron’s Portable People Meter (PPM)

A year after the rollout was complete, I wrote “Top Ten Things to Do as a New PD in a PPM Market,” a list of strategic guidelines for new radio programmers in North American markets measured by the Portable People Meter™.

Now that much of the radio industry has lived with PPM for a decade, let’s look back on the advice through a 2018 lens. New commentary is italicized.

1. Root all of your thinking first and foremost in the strategy of the station. Don’t go in with a PPM mindset; go in with the mindset of developing a brand by exploiting an available market position. Your goal should be to develop a strong brand and to make the station entertaining and focused. Once you know “who you are” and what your brand message is and how you want to communicate that to the audience, then start thinking PPM.

Especially in the first few years of the methodology, programmers focused a significant amount of time on PPM manipulation. Maybe, just maybe, we can squeeze an extra quarter hour here and there by playing the PPM game.

10 years later, I think radio strategy has generally reverted back to where it was, with brand focus as the most important component. The PPM panel is just as difficult to manipulate. Big brands are long lasting. Manipulation tactics are not.

2. Do a complete brand and content audit of the station. Don’t go to the office for the first two days or meet with staff. Stay at home or in your hotel and listen to and quantify all the verbal and non-verbal content. How much music do you play? How much do your DJ’s and personalities talk? What do they talk about? What are the features? Promotions? How does the station stage and image its music? What is the station’s positioning and how often do you communicate it?

What we learned in our 2008 study “Real PPM Panelists Tell All” was that every interruption had some detrimental impact on the ratings. The instinctive reaction of many programmers was to wipe the station clean – 30 second promos became 10 seconds, IDs were five seconds, jocks talked less.

What’s important to understand is that interruptions, while detrimental in the moment, can be additive to the brand. So, make sure every interruption has brand value. If it builds the brand, it’s worth it.

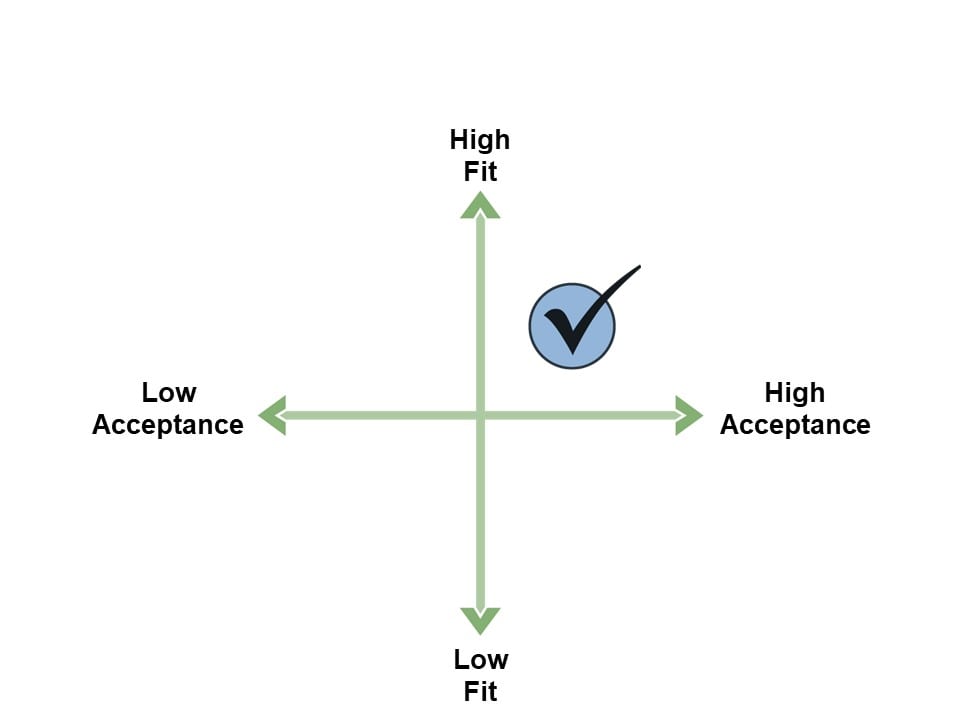
3. Rate all the content on the station on a 1-10 brand scale and a 1-10 execution scale. The brand scale means how each element on the station fits or resonates with the brand essence of the station. Does it fit with the images you want to project? Do the same with the in the moment execution. Is it entertaining? Tight? Would a listener stay tuned in that moment? Rate everything on a 1-10 scale. Anything that is low on both “brand values” and “in the moment entertainment” should be eliminated or tightened. Possible culprits might be DJ chatter that is not compelling. Sales promos. Worry less about content that supports the brand identity. Music features, entertaining DJ content from personalities who are well known and liked.

It’s always been challenging for PDs to subjectively evaluate content. In the moment, we overthink and overreact. By doing regular monitors on your stations, writing down each break and piece of content and rating it on a simple scale, it’s easy to quickly determine what’s brand additive and what isn’t.

4. Do an abbreviated analysis of your main competitors. What are they doing in music, talk, features, positioning, and spot placement? React to their programming tactics where it is smart. Know their pure programming advantages so you can cover them where it makes sense. One thing for sure is that you don’t want them to be tighter or better programmed for PPM than your station since small advantages can sometimes mean a lot when it comes to PPM performance.

Studying your competition as well as your own station is always a good idea. Prepare for your opponents like a head coach.

5. Don’t be afraid to put on content that will impact the audience emotionally even if in the moment you cause some tune-out. There are two ways to build ratings and one is more important than the other. First, you can put on content that causes people to like your station. Content that causes an emotional reaction and a desire to be associated with your station. Second you can reduce “tune-outs”, those things that cause people to tune away for a minute or an hour. Both are important, but you should recognize that you can impact the ratings positively even if in the moment some people tune-out. Some things that cause a little short term tune-out will actually stick in the head of your P1’s and create a long term bond. Keep the things that are a 10 on the brand evaluation scale, even if a few people tune away when you do them.

As in #2, build the brand and accept in-the-moment loss. While even the strongest content may cause tune-out, it will grow your brand and ultimately grow the audience over time.

6. Understand the ins and outs of PPM ratings, including the fact that PPM, like diary, is research and not immune to statistical wobble. Really understand margin of error and then learn how to aggregate ratings for programming elements of the station. Know the numbers behind each number you look at like the difference between looking at a daypart with 20 meters and one with 100 meters.

The difficulties reaching potential panelists, and certainly the erosion of the landline over the past 10 years, has compounded this problem. By utilizing perceptual research, like our Plan Developer, you can track essential measurements like Cume and P1 with larger sample sizes than may be available with ratings. An added benefit of perceptual research is the ability to monitor your perceptual position in the market, including your strengths, weaknesses and opportunities.

7. Understand panel dynamics so that you don’t react to ratings increases or decreases that are a function of normal panel change or evolution. Sometimes ratings will increase a little just because you have a few more P1’s in the sample as a result of panel turnover. Sometime you will lose listeners. This is normal and you need to know when it is happening to your station. Don’t over-believe the good numbers and temper your reaction to the weak ones. They will more often than not be in a statistically valid range.

This has improved over time as Nielsen has provided and added tools to better understand and get a granular look at the panel.

8. Learn how to manage weekly ratings and expectations. All ratings have wobble and fluctuations. In diary markets, most GMs and PDs know not to overreact to monthlies or even whole books. But, in a PPM world there is often a belief that weeklies and monthlies have more credence than similar ratings spans in a diary world. However, with PPM, just like any research, there is random and normal fluctuation. So, you need to be able to set the table on how to react to weeklies, monthlies and ratings in general. Tell your new GM that you don’t want to look at weeklies or discuss them each week. Don’t download them at 11am each Tuesday and make it a big event. Look at them every three or four weeks.

Fortunately, the weekly obsession does not appear to be pervasive in 2018. But there is more focus now on meter count, and there’s still the danger of focusing on too much of this at the expense of brand focus and taking your eye off the ball.

9. Understand causation vs. simple correlation. Realize that every time your ratings go up or down it is not necessarily related to that hours, days or weeks programming. Often there will be a random correlation between a programming event and ratings. More often than not, it will be just a correlation and the two events will not be causally related.

Remember that listeners are not paying close attention to your radio station. They remember events selectively and select radio stations based on habit, needs, perceptions, language and lifestyle. More often than not, a correlation from event to ratings will be by chance, not because you caused it.

10. Experiment. If you don’t know for sure what causes your ratings to go up or down, experiment to find out. For example, if your hot rotation on currents is 3 hours, go to 2.5 every other week for 20 weeks. Divide your ratings in to two 10 week periods. See if the 10 2.5 hour rotation weeks show any ratings difference from the 10 3 hour rotation weeks. Do tighter rotations work or not? Aggregate enough weeks to have a statistically valid comparison. Also, if you do this, look at other variables that might be impacted. For example, does the burn on songs change with tighter rotations? Are there fewer or more highly popular songs?

A/B testing is all the marketing buzz, though testing of messaging has been around for decades! Just as Google and Amazon test the delivery of their product, there’s no reason why radio stations shouldn’t test theirs as well. Perhaps you try variations of clocks every other day. Maybe you play 200 songs one day and 300 songs every other day. Run stopsets differently every other day. Compile a year of ratings data and compare. If you really want to get granular with Nielsen data, do it over a long enough period of time to formulate actionable plans based on that data.

10 years after the debut of PPM in the top 10 markets and seven years after writing these tips, the general principles of successful programming haven’t changed. If you’re:

  • Always thinking strategically
  • Staying true to your brand
  • Maintaining focus and discipline
  • Not overreacting
  • Testing and tracking results over time

…you’re positioned for PPM success in 2018 and beyond.

Coleman Insights And Media Monitors Find That “Turn On-Turn Offs” Dominate Radio Listening Occasions

RESEARCH TRIANGLE PARK, NC & WHITE PLAINS, NY, January 6, 2016—A major new study of Nielsen Audio Portable People Meter (PPMTM) data reveals that nearly two-thirds of radio station listening occasions consist of listeners “turning on” a station and end with them “turning off” a station, as opposed to “switching in” from and “switching out” to other stations. This is the major finding of “The Components of Tuning Occasions – Switching vs. Turning” study the two companies previewed at last month’s Nielsen Audio Client Conference and released today. It is based on an analysis of nearly 37 million listening occasions captured in all 48 United States radio markets measured by Nielsen Audio’s PPM measurement system in October 2014, January 2015, April 2015 and July 2015.

To complete the study, Coleman Insights and Media Monitors classified listening occasions as “Turn On-Turn Offs,” “Turn On-Switch Outs,” “Switch In-Switch Outs” and “Switch In-Turn Offs” based on how they began and ended. They found that 62.7% of all occasions are Turn On-Turn Offs, while 11.3% are Turn On-Switch Outs, 14.5% are Switch In-Switch Outs and 11.5% are Switch In-Turn Offs. It is the opinion of both companies that the proportion of occasions that involve Turning On and Turning Off is significantly higher than the expectations of most radio programmers and managers.

The study produced two other major findings about listening occasions:

1.  Occasions that begin with Turn Ons are five minutes longer on average than those that begin with Switch Ins, suggesting that stations can theoretically generate more Time Spent Listening under PPM measurement by increasing the proportion of listening occasions they generate through Turning On.

2.  The proportion of a station’s occasions that are Turn On-Turn Offs among its P1 listeners—those who listen to a station more than any other—is even higher. While 62.7% of all occasions are Turn On-Turn Offs, the figure soars to 78.6% among P1 listeners.

“These findings are about the strongest reinforcement of the value of brand-building for radio stations that I can imagine,” commented Coleman Insights president/chief operating officer Warren Kurtzman, who co-authored the study. “The ability of a radio station to generate listening occasions through Turning On is dependent on having a strong brand, which is based on having high awareness, a clearly-defined position, association with multiple product attributes and eliciting passion from the audience.”

“The Components of Tuning Occasions – Switching vs. Turning” also reveals where Switching—when listeners switch between radio stations—plays its most significant role. Switching is more prevalent among younger listeners than older listeners and, as a result, is observed at higher levels for stations that offer formats that tend to attract younger audiences.

“Our study points to how those who program younger-targeted formats such as CHR, Rhythmic CHR, Alternative, Hot AC, Rhythmic AC, Urban and Active Rock need to be more concerned with preventing listeners from Switching Out than those who program other formats do,” noted study co-author and Media Monitors president/chief executive officer Philippe Generali. “Having a strong brand is clearly important, but for many stations, preventing Switching clearly can have a significant impact on their PPM performance.”

Nielsen subscribers can download a free report detailing the study’s findings at the Nielsen client portal, https://bit.ly/ppmcomponents. The report includes an important note about its use of plain language terms such as “Switch In” and “Turn On.”  This note emphasizes that PPM provides insights about exposure to radio and users should not assume that PPM data reflects a perfect proxy for consumer choice and behavior.

About Coleman Insights

Coleman Insights, headquartered in Research Triangle Park, NC, with offices in Philadelphia and Hamburg, Germany, is a firm that has helped media properties build strong brands and develop great content since 1978. Its clients include hundreds of media properties in North America, South America, Europe and Asia, including those owned by CBS Corporation, Sony Corporation, Emmis Communications, The Walt Disney Company, iHeartMedia, EMI, Warner Music Group, SummitMedia, American Public Media, Bonneville International Corporation, Vivendi SA, Hubbard Radio, Newcap Radio, Lagardère International, Grupo Prisa, Mid-West Family Broadcast Group, Salem Communications, The Mondadori Group, Connoisseur Media, Corporación Radial del Perú, SBS Broadcasting, Townsquare Media and Alpha Media. Additional information about Coleman Insights is available at www.ColemanInsights.com.

About Media Monitors

Media Monitors is the nation’s leading broadcast monitoring and verification service for broadcasters, print media, media investment companies and advertising agencies. Media Monitors is a subsidiary of RCS, the world’s largest provider of broadcast and webcast software. Media Monitors and its logo are registered trademarks of Media Monitors. The Media Monitors broadcast content recognition process of audio fingerprinting used by Media Monitors is protected by U.S. Patent 7,386,047. For more information, visit www.mediamonitors.com.

Press Contacts:

Katie Dombrowski

Coleman Insights

919-226-0458

KatieDombrowski@ColemanInsights.com


Dwight Douglas

Media Monitors

914-259-4733

ddouglas@rcsworks.com

###